In 1952 when Queen Elizabeth II came to the throne, the UK was a major economic power, but still reeling from the costs of the Second World War, with rationing and austerity still visible. The post-war period saw a remarkable rising living standards, strong economic growth and radical changes in the economy, but also saw the UK lose its pre-eminent position as it fell behind its major competitors. As we enter 2022, in a symbolic moment, the UK economy has recently been overtaken by India, a former colony of the British Empire, and something that would have been unthinkable in 1952.
Real GDP

- In 1952, real GDP per capita was £7,533
- In 2022, real GDP per capita was £32,555
Real living standards have increased 4.5 times, and this is reflected in the much greater choice of consumer goods that we can enjoy in 2022. In just 15 years from 1950 to 1965, real incomes rose 40%. Back in 1952, household goods like TVs were a rarity and so many goods like computers and mobile phones a long time from being invented. In 1950, just 1% owned television sets; by 1965 that had risen to 25%. However, since 2009, the post-war economic boom looks like a different era, with economic growth per capita starting to stagnate and only seing marginal increases in living standards. The arrival of rising energy prices and unexpectedly high inflation, risk pushing the UK in to a new ‘winter of discontent’.

UK productivity growth has fallen from its post-war productivity, due to a combination of factors, such as diminishing returns from technology, and the shock of the financial crisis and Brexit.
Health
The NHS was set up in 1947 and combined with reduced poverty and improved medical treatments, we have seen a sharp rise in life expectancy, with average life expectancy rising from 69.2 (1952) to 81.7 (2022) The only concern is that the improvement in life expectancy has stalled in recent years, and the NHS despite growing amounts of spending is struggling to keep up.
Another indicator of how the nation’s health has improved is the dramatic fall in infant mortality from 29.1 deaths per 1,000 in 1952 to just 3.4 today.
The only difficulty of the rising life expectancy is that it has put pressure on pension and health care spending. With an ageing population, a greater share of GDP is going on pension spending and has forced the government to raise the retirement age.
Environment
Another improvement we have seen since 1952 is the major improvement in air quality, mainly stemming from the decline in coal burning. In 1952, London suffered from the Great Smog of London which saw the deaths of 12,000 people and many more suffering long-term health issues. This led to the Clean Air Act of 1956 which introduced smoke control areas, in which coal could no longer be burnt in cities. It is hard to imagine back in 1952, the dominance of coal in the economy. It was a major source of electricity, but also the entire train network (carrying a high % of traffic) was powered by steam locomotives. In 1952, there were 716,000 coal miners, today only 1,000. The decline of the coal industry has left scars on former coal communities but has also led to a dramatic fall in UK CO2 emissions, falling to a level not seen since the nineteenth century.

However, whilst CO2 emissions and visible smogs have fallen, we retain real problems with air quality from invisible pollutants such as nitrogen dioxide. A report suggested still 97% of UK homes exceed WHO guidelines on at least one type of air pollutant. Also, in 2022, we are much more acutely aware of global environmental problems. When Prince Charles raised environmental issues back in the 1970s, it was something of an outlier, but in 2022, dramatic changes in the climate and rising sea levels have helped to make it a prominent issue of the day.
Structure of the economy
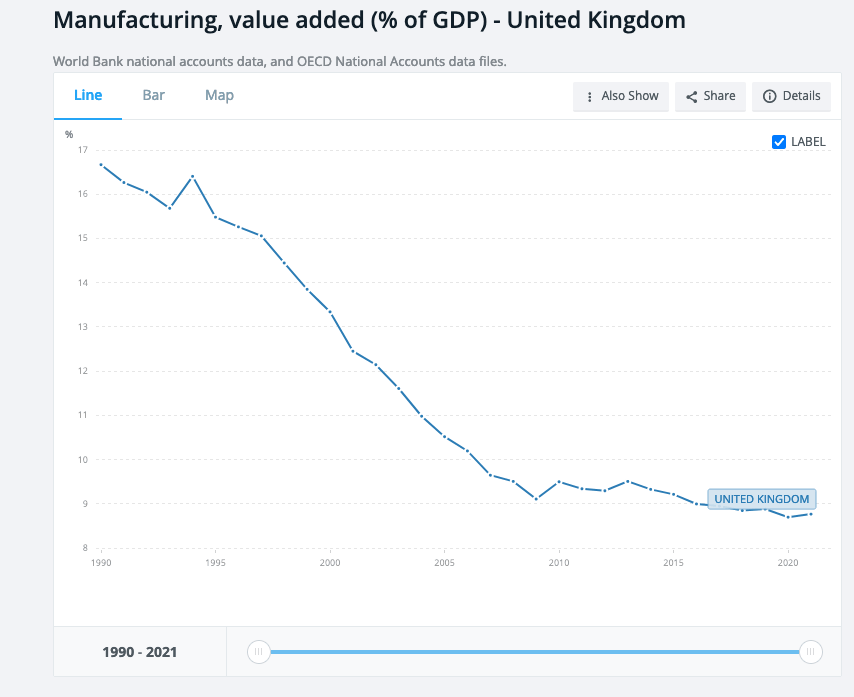
In 1950, the Bank of England reported that manufacturing accounted for 33% of UK’s GDP. This has fallen to less than 10% in 2022. The UK has become a service sector-based economy, with new jobs in finance, tourism, retail and hospitality sectors. Britain was the pioneer of manufacturing leading the industrial revolution, but the second Elizabethan era has seen this fall away.

UK current account balance has largely been in deficit since the early 1970s.
National Debt

In 1953, UK national debt was 165% of GDP, – very high by today’s standards but already lower than the post-war peak of the late 1940s. The long period of economic expansion during Queen Elizabeth’s first few decades saw national debt fall dramatically, despite higher spending on the NHS, the new welfare state and public housing. It is a revealing insight into the power of economic growth to increase tax revenues. However, again, the progress on debt has been reversed in recent years, with the 2008 financial crisis and then Covid pushing debt back up towards 100% of GDP. With a huge energy bailout to come shortly, UK debt is forecast to soar – but this time we may not be able to rely on the same level of economic growth.
Inequality
In the 1950s, the UK was a class-bound and unequal society. In 1952, the top 1% owned 48.5% of the nation’s wealth, by 2022, this had fallen to 21.3%.
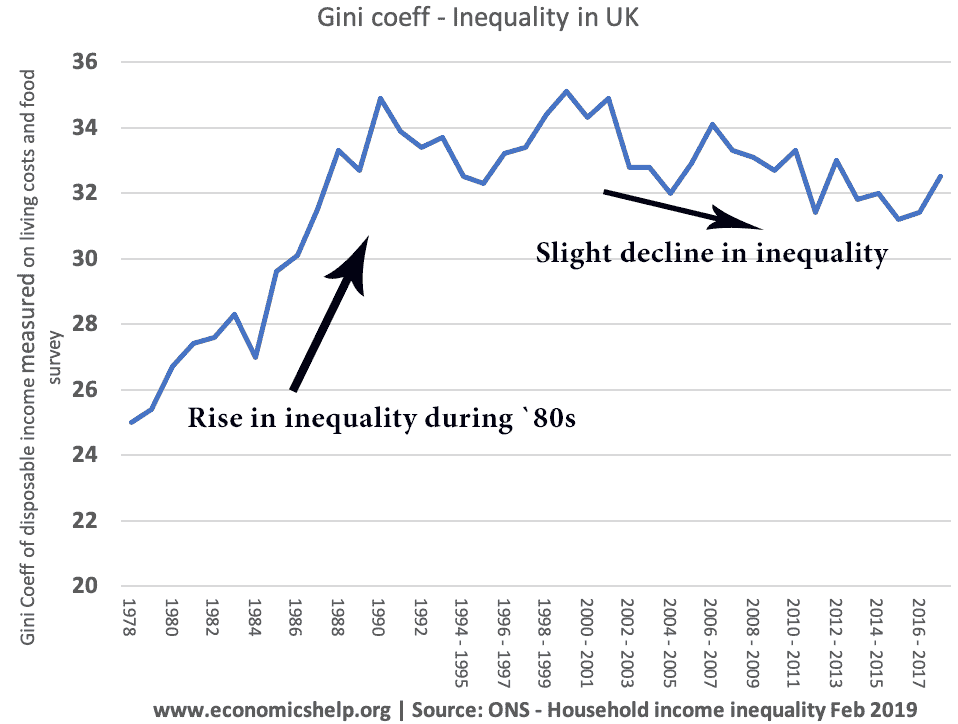
The story of income inequality is more mixed. Generally, inequality fell in the post-war period until the late 1970s, but during the 1980s, income inequality rose once again.

In 2022, Britain is something of a more equal society than in the 1950s, with much greater educational opportunities. This is particularly striking when we look at the numbers attending higher education. The number of women at university has risen from 23,000 in 1952 to 1,569,000 in 2022. A radical change. In the same time period, the number of men increased from 78,000 to 1,178,000. However, whilst we have excelled in sending more to university, the economy still suffers skills shortages in important areas, with vocational training often lagging behind what the economy really needs. By the early 1980s, around 85% of school leavers in France and West Germany received vocational training, compared with just 40% in the UK.
Inflation

In 1952, when the Queen came to the throne, the inflation rate was remarkably similar to today, with inflation topping 10.7%, compared to the 9.9% we see today. It was partly due to a commodity boom, related to the Korean war. It was also caused by strong economic growth. When the Korean War ended in 1953, inflation soon subsided and remained low into the 1970s. The 50s and 60 saw low inflation as the economy entered what is called a ‘goldilocks’ period of high growth and low inflation. Today there are some parallels with 1952, with cost-push inflation also caused by Ukraine War, but the current inflation looks more stubborn and might not so easily be reduced. Also, the 1950s and 60s was a period of rapidly growing real wages. Whereas in the 2020s, we are seeing stagnating real wages with workers struggling to keep up with inflation
Unemployment

Another present similarity with 1952 is low unemployment. Unemployment in 1952 stood at 2.4% an indication the economy was close to full employment. In 2022, the unemployment rate is 3.4% although quite different circumstances with low growth in real pay and a rise in long-term sickness causing lower labour market participation. In 1952, the unemployment rate of 2% led to real worker shortages and led to a period of encouraging migration from former Commonwealth countries. This net migration fundamentally changed the economic and social make-up of the UK and helped to cause a rise in the population from 50.4 million in 1952 to 68.3 million in 2022.

However, it wasn’t until the 1990s and 2000s, that much higher levels of net migration would come, with at least 50% coming from Europe.
Pound Sterling
Despite the good rates of economic growth in the post-war period, the Pound Sterling has steadily fallen during the reign of Queen Elizabeth, reflecting the retreat of the British Empire and the UK’s relative decline, due to lower productivity and lower economic growth than our main competitors

In 1949, the Pound had already experienced a major devaluation from $4.03 to £2.80 per Pound. Since the 1950s, the Pound has fallen further to its current rate of $1.23. It means that UK purchasing power has fallen relative to the US and our European neighbours.
The reason for the fall in the pound is due to lower productivity growth, higher inflation and the long-term decline of the UK both economically and politically.

This shows that in 1950, UK productivity was 80% greater than West Germany by 1974, productivity had fallen and was now nearly 20% lower.
Housing

In 1952, average house prices were £1,891 and home-ownership rates were quite low (35% in 1939). Over the next few decades, home ownership rose rapidly (46% in 1966) as rising incomes enabled more to buy. There was also an unprecedented rise in home building as the UK built more council housing to deal with the post-war shortage.

Homeownership peaked in the early 2000s with around 70% of homes privately owned. But since then has fallen to 63% – as the price of housing has risen faster than incomes, making the dream of owning a home unaffordable. It is one factor which is contributing to a cost of living crisis, meaning the great gains in real income are somewhat lost.
External link
- UK Economy 1952-2022 Economics Observatory
Further reading
Your graphs etc are very informative and show that
Government goals have met moderate success –
growth
full employment
2% inflation
exchange rate stability £
balance of payments
”equity” regional etc
(re-election)