
The UK has avoided any situation of hyperinflation. The highest rates of inflation were after the Napoleonic War in the early nineteenth century. During the First World war (25%) and in the 1970s where inflation rose due to a rise in oil prices and strong wage growth.
After the late 1980s inflation was brought under control, inflation remained for nearly two decades – during a period known as the great moderation. However since 2008 we have seen periods of cost-push inflation, most notably in 2022, with inflation rising close to 10% due to rising oil, gas and food prices.
Inflation means an increase in the general price level and has the effect of reducing the value of money. Rising prices mean money buys less than it used to. See: Definition of Inflation
Inflation since 1860

Inflation 1949-2015

Periods of Inflation in UK
1920s/30s deflation
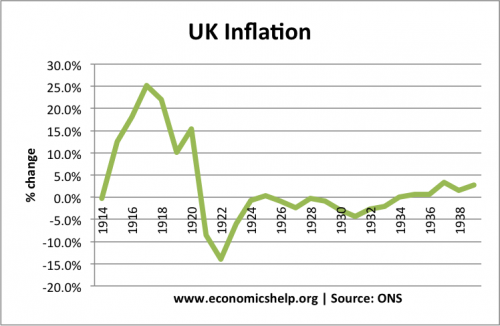
After the inflation of the First World War, the UK experienced deflation (falling prices) during the 1920s and early part of 1930s. This deflation was due to tight monetary and fiscal policy and an overvalued exchange rate (Gold Standard).
See more detail at: Economics of the 1920s
Inflation in the 1960s and 1970s
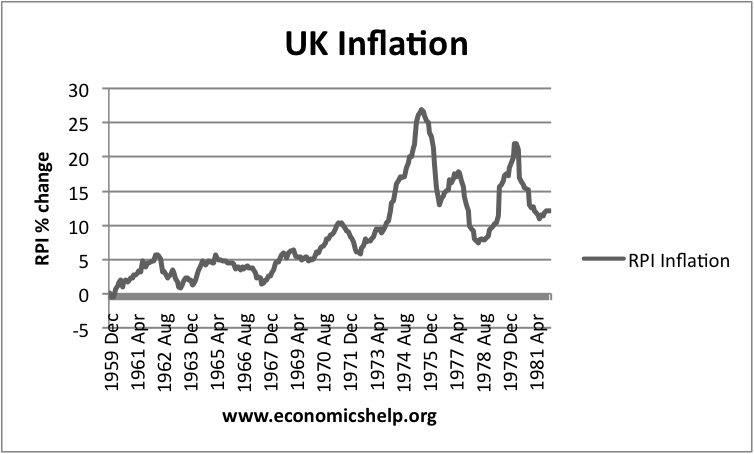
In the post-war period, the UK economy experienced strong growth with moderate inflation.
However, in the 1970s, we see inflation rising to double figures and reaching over 25%.
This inflation was due to rising oil prices (oil prices tripled in the 1970s). There was also inflation due to rising wages. Unions were relatively powerful and were bargaining for higher wages to keep up with the rising cost of living – causing a wage-inflationary spiral.
See also: economics of the 1970s
Inflation since 1989

Towards the end of the 1980s, the UK experienced rapid economic growth. This growth of 4-5% a year was significantly higher than the UK’s long run trend rate of economic growth. This excessive economic growth led to demand-pull inflation of 8%. See: Lawson boom.
In 2022, the inflation was cost-push inflation caused by rising energy, food and fuel prices.
Periods of Inflation In UK
Deflation of the 1920s and 1930s.
The UK hasn’t always had inflation. In the 1920s and 30s, there was a long period of deflation (falling prices). This meant the value of money increased. The 1920s and 30s, were generally a period of low growth and high unemployment.
Inflation of the 1970s
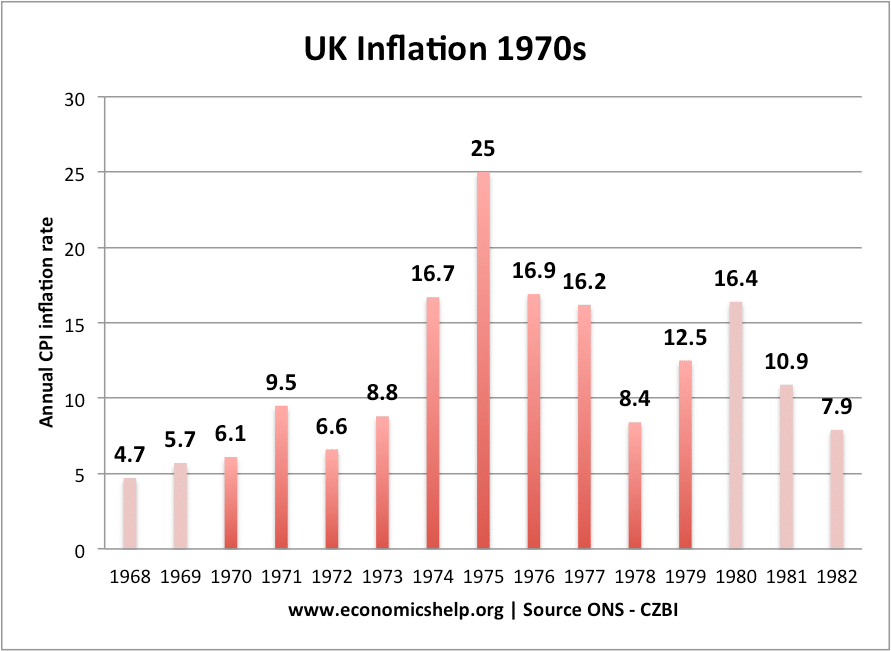
The highest peace time inflation occurred in the 1970s, when inflation rose due to wage push and oil push inflation. See: Economy of the 1970s
Cost push inflation of 2008/12 and 2022
- Since 2008, periods of inflation have been mainly due to cost-push factors. For example
- 2008 – due to rising oil prices.
- 2012 – Higher taxes, rising import prices from devaluation.
- 2022 – Rising oil and gas prices, rising food prices. Effect of devaluation, Covid supply chain issues, Brexit cost issues. Supply side constraints.
Inflation 2008 – 22

he UK experienced periods of cost-push inflation during 2008-2013. This inflation was caused by rising oil prices, devaluation of Pound and higher taxes. See: Cost push inflation
Historical Inflation and Interest rates
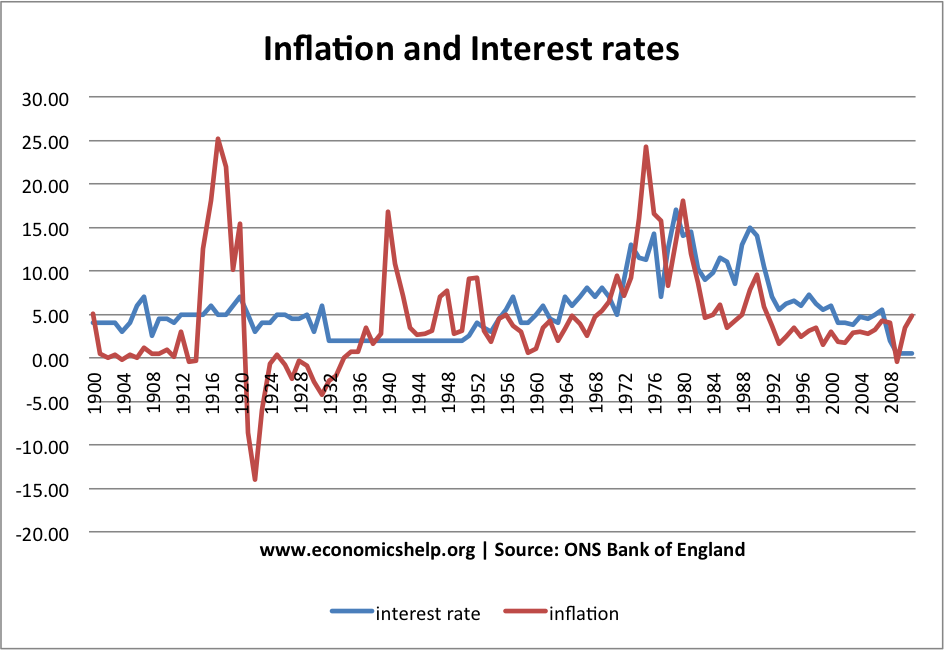
Inflation and Interest Rates since 1900
Interest rates and Inflation since 2003

Before, 2008, interest rates were generally higher than inflation. But since the financial crash of 2008, interest rates have been close to zero because of weak economic growth. This means inflation has mostly been higher than interest rates – causing negative real interest rates.
More historical interest rate data.
Related
Inflation in UK (year end)
| 2022e | 8.0 |
| 2021 | 2.6 |
| 2020 | 1.5 |
| 2019 | 2.6 |
| 2018 | 3.3 |
| 2017 | 3.6 |
| 2016 | 1.8 |
| 2015 | 1.0 |
| 2014 | 2.4 |
| 2013 | 3.0 |
| 2012 | 3.2 |
| 2011 | 5.2 |
| 2010 | 4.6 |
| 2009 | -0.50% |
| 2008 | 4.00% |
| 2007 | 4.30% |
| 2006 | 3.20% |
| 2005 | 2.80% |
| 2004 | 3.00% |
| 2003 | 2.90% |
| 2002 | 1.70% |
| 2001 | 1.80% |
| 2000 | 3.00% |
| 1999 | 1.50% |
| 1998 | 3.40% |
| 1997 | 3.10% |
| 1996 | 2.40% |
| 1995 | 3.50% |
| 1994 | 2.40% |
| 1993 | 1.60% |
| 1992 | 3.70% |
| 1991 | 5.90% |
| 1990 | 9.50% |
| 1989 | 7.80% |
| 1988 | 4.90% |
| 1987 | 4.20% |
| 1986 | 3.40% |
| 1985 | 6.10% |
| 1984 | 5.00% |
| 1983 | 4.60% |
| 1982 | 8.60% |
| 1981 | 11.90% |
| 1980 | 18.00% |
| 1979 | 13.40% |
| 1978 | 8.30% |
| 1977 | 15.80% |
| 1976 | 16.50% |
| 1975 | 24.20% |
| 1974 | 16.00% |
| 1973 | 9.20% |
| 1972 | 7.10% |
| 1971 | 9.40% |
| 1970 | 6.40% |
| 1969 | 5.40% |
| 1968 | 4.70% |
| 1967 | 2.50% |
| 1966 | 3.90% |
| 1965 | 4.80% |
| 1964 | 3.30% |
| 1963 | 2.00% |
| 1962 | 4.30% |
| 1961 | 3.40% |
| 1960 | 1.00% |
| 1959 | 0.60% |
| 1958 | 3.00% |
| 1957 | 3.70% |
| 1956 | 4.90% |
| 1955 | 4.50% |
| 1954 | 1.80% |
| 1953 | 3.10% |
| 1952 | 9.20% |
| 1951 | 9.10% |
| 1950 | 3.10% |
| 1949 | 2.80% |
| 1948 | 7.70% |
| 1947 | 7.00% |
| 1946 | 3.10% |
| 1945 | 2.80% |
| 1944 | 2.70% |
| 1943 | 3.40% |
| 1942 | 7.10% |
| 1941 | 10.80% |
| 1940 | 16.80% |
| 1939 | 2.80% |
| 1938 | 1.60% |
| 1937 | 3.40% |
| 1936 | 0.70% |
| 1935 | 0.70% |
| 1934 | 0.00% |
| 1933 | -2.10% |
| 1932 | -2.60% |
| 1931 | -4.30% |
| 1930 | -2.80% |
| 1929 | -0.90% |
| 1928 | -0.30% |
| 1927 | -2.40% |
| 1926 | -0.80% |
| 1925 | 0.30% |
| 1924 | -0.70% |
| 1923 | -6.00% |
| 1922 | -14.00% |
| 1921 | -8.60% |
| 1920 | 15.40% |
| 1919 | 10.10% |
| 1918 | 22.00% |
| 1917 | 25.20% |
| 1916 | 18.10% |
| 1915 | 12.50% |
| 1914 | -0.30% |
| 1913 | -0.40% |
| 1912 | 3.00% |
| 1911 | 0.10% |
| 1910 | 0.90% |
| 1909 | 0.50% |
| 1908 | 0.50% |
| 1907 | 1.20% |
| 1906 | 0.00% |
| 1905 | 0.40% |
| 1904 | -0.20% |
| 1903 | 0.40% |
| 1902 | 0.00% |
| 1901 | 0.50% |
| 1900 | 5.10% |
| 1899 | 0.70% |
| 1898 | 0.30% |
| 1897 | 1.50% |
| 1896 | -0.30% |
| 1895 | -1.00% |
| 1894 | -2.00% |
| 1893 | -0.70% |
| 1892 | 0.40% |
| 1891 | 0.70% |
| 1890 | 0.20% |
| 1889 | 1.40% |
| 1888 | 0.70% |
| 1887 | -0.50% |
| 1886 | -1.60% |
| 1885 | -3.00% |
| 1884 | -2.70% |
| 1883 | -0.50% |
| 1882 | 1.00% |
| 1881 | -1.10% |
| 1880 | 3.00% |
| 1879 | -4.40% |
| 1878 | -2.20% |
| 1877 | -0.70% |
| 1876 | -0.30% |
| 1875 | -1.90% |
| 1874 | -3.30% |
| 1873 | 3.10% |
| 1872 | 4.70% |
| 1871 | 1.40% |
| 1870 | 0.00% |
| 1869 | -5.00% |
| 1868 | -1.70% |
| 1867 | 6.10% |
| 1866 | 6.50% |
| 1865 | 0.90% |
| 1864 | -0.90% |
| 1863 | -3.60% |
| 1862 | -2.60% |
| 1861 | 2.70% |
| 1860 | 3.70% |
| 1859 | -1.80% |
| 1858 | -8.40% |
| 1857 | -5.60% |
| 1856 | 0.00% |
| 1855 | 3.30% |
| 1854 | 15.10% |
| 1853 | 9.30% |
| 1852 | 0.00% |
| 1851 | -3.00% |
| 1850 | -6.40% |
| 1849 | -6.30% |
| 1848 | -12.10% |
| 1847 | 12.00% |
| 1846 | 4.00% |
| 1845 | 4.90% |
| 1844 | -0.10% |
| 1843 | -11.30% |
| 1842 | -7.60% |
| 1841 | -2.30% |
| 1840 | 1.80% |
| 1839 | 7.30% |
| 1838 | 0.70% |
| 1837 | 2.50% |
| 1836 | 11.00% |
| 1835 | 1.70% |
| 1834 | -7.80% |
| 1833 | -6.10% |
| 1832 | -7.40% |
| 1831 | 9.90% |
| 1830 | -3.60% |
| 1829 | -1.00% |
| 1828 | -2.90% |
| 1827 | -6.50% |
| 1826 | -5.50% |
| 1825 | 17.40% |
| 1824 | 8.60% |
| 1823 | 6.80% |
| 1822 | -13.50% |
| 1821 | -12.00% |
| 1820 | -9.30% |
| 1819 | -2.50% |
| 1818 | 0.30% |
| 1817 | 13.50% |
| 1816 | -8.40% |
| 1815 | -10.70% |
| 1814 | -12.70% |
| 1813 | 2.50% |
| 1812 | 13.20% |
| 1811 | -2.90% |
| 1810 | 3.20% |
| 1809 | 9.70% |
| 1808 | 3.40% |
| 1807 | -1.90% |
| 1806 | -4.40% |
| 1805 | 16.20% |
| 1804 | 3.20% |
| 1803 | -5.90% |
| 1802 | -23.00% |
| 1801 | 11.70% |
| 1800 | 36.50% |
| 1799 | 12.30% |
| 1798 | -2.20% |
| 1797 | -10.00% |
| 1796 | 6.40% |
| 1795 | 11.60% |
| 1794 | 7.70% |
| 1793 | 2.80% |
| 1792 | 1.50% |
| 1791 | -0.10% |
| 1790 | 1.80% |
| 1789 | -1.30% |
| 1788 | 4.00% |
| 1787 | -0.60% |
| 1786 | 0.00% |
| 1785 | -4.00% |
| 1784 | 0.60% |
| 1783 | 12.00% |
| 1782 | 2.10% |
| 1781 | 4.10% |
| 1780 | -3.40% |
| 1779 | -8.50% |
| 1778 | 4.00% |
| 1777 | -0.40% |
| 1776 | -2.20% |
| 1775 | -5.60% |
| 1774 | 0.90% |
| 1773 | -0.30% |
| 1772 | 10.70% |
| 1771 | 8.50% |
| 1770 | -0.40% |
| 1769 | -8.20% |
| 1768 | -1.10% |
| 1767 | 5.80% |
| 1766 | 1.20% |
| 1765 | 3.50% |
| 1764 | 8.90% |
| 1763 | 2.70% |
| 1762 | 3.90% |
| 1761 | -4.50% |
| 1760 | -4.50% |
| 1759 | -7.90% |
| 1758 | -0.30% |
| 1757 | 21.80% |
| 1756 | 4.20% |
| 1755 | -6.00% |
| 1754 | 5.10% |
| 1753 | -2.70% |
| 1752 | 4.70% |
| 1751 | -2.70% |
| 1750 | 0.00% |
Source: Historical UK Inflation
uk
Thank you for this useful data. Just a typo to report. The interest rates and inflation since 1979 chart has Series 1 and Series 2 instead of interest rates and inflation.
Very helpful thanks. Don’t know where I’d be without economics help 🙂
In 2022, there’s also a demand side. This is what I feel economists aren’t seeing. Yes the cost is pushing the consumer away, but it’s also the demand from cheap money circulating within the system. As you keep on hearing, “Too many dollars chasing too few goods”. It’s simple…