Readers Question: What is Canada’s National debt?
It is a little hard to decipher as there seem to be two different measures.
- Net Federal Debt – NetDebt owned by federal government
- Gross General Government Debt
The second statistic – Gross General Government debt includes debt by local and state governments and so gives a higher figure.
Federal Debt
- Net Federal debt stood at $582.5 billion at March 31, 2010.
- At start of 2010, Canada’s GDP stood at $1.574 trillion (2010)
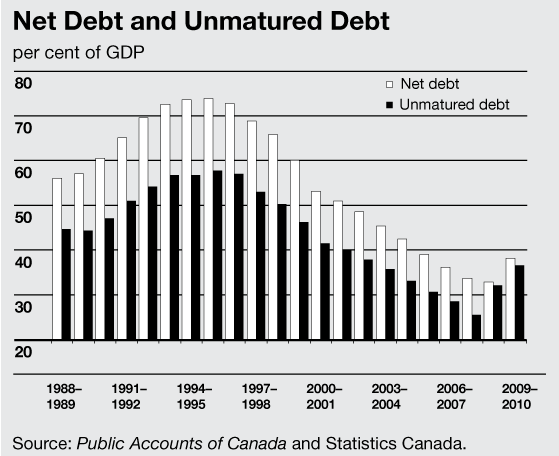
- As a per cent of GDP, net Federal debt stood at 38.1 per cent in 2009–10, up 5.3 percentage points from 2008–09 and down 35.7 percentage points from its peak of 73.9 per cent in 1995–96.
(annual finance report of Canada)
Net debt includes a list of liabilities
- Accounts payable
- unmatured interest paying debt (bonds e.t.c)
- pensions and other liabilities
This gives total liabilities of $883bn
However, the statistics list £300bn assets, giving a figure for net federal debt of $582bn
History of National Debt Canada
(Source: annual finance report of Canada)
Gross Government Debt
The only figure for Gross government debt I can find is sourced by the CIA factbook at 84% of GDP, but I can’t find a source for the CIA statistics outside the CIA. By the way, Wikipedia page on Canada Economy cites as a source for 84% the Canada Financial report, but there is no mention of 85% their – only the 38% of GDP.
Canada should really do a better job at providing statistics on public sector debt. The UK is not easy, but at least every month you can find up to date statistics on public sector debt. (though there are still disputes as to what should be counted as public sector debt)
Statistics
- Canada Stats for federal Debt – seems to stop in 2008
- List of National debt by country


Too bad this chart doesn’t cover the 60’s (Pearson) or the 70’s (PET)…any idea were I could get that data?
You can find the info at the Finance Dept’s website under yearly Fiscal Reference Tables (FRTs) – note tables published from 2003 & later, provide data not directly comparable to data provided for years prior to FY83-84 due to the GoC’s change in accounting practices [to full accrual accounting]. The FRTs whose publication dates before 2003 are comparable to all years listed in the range.
The FRTs provide data on all public sector debt (federal, provincial/territorial & municipal) – tables published up to & including 2001 provide federal data from FY46-47 to the year of publication, tables published after 2001, federal data is provided from FY61-62 to year of publication.
Data for the provinces/territories & municipalities range in age from the early 60’s to early 90’s.
The “national” debt should include the provincial debts as well, because the provinces have collectively as much spending power as the federal government, are largely autonomous, and also hold almost as much debt.
Citing just the federal debt is a gross underestimation of Canada’s debt problems. It is the figure that the jingoistic media uses to make Canadians feel that we are better than Americans or Europeans, when in reality we are in the same boat. The 84% of GDP is probably closer to accuracy.
why do you not list the national debt starting in 1935 and then what happened when we joined the G7.
Why are you folks not showing the whole picture?
When a business owes more money than it makes it is bankrupt…jus sayin.