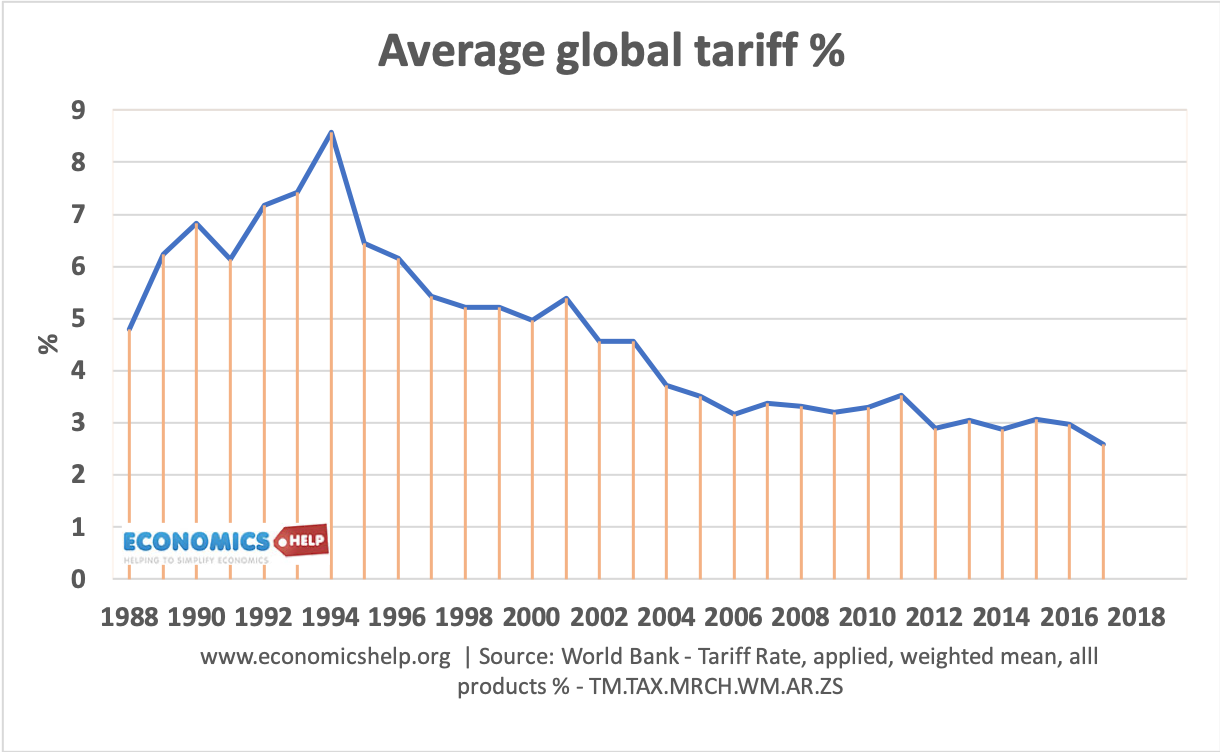


Slowbalisation – a phenomena which involves a slowing down of the pace of global integration.
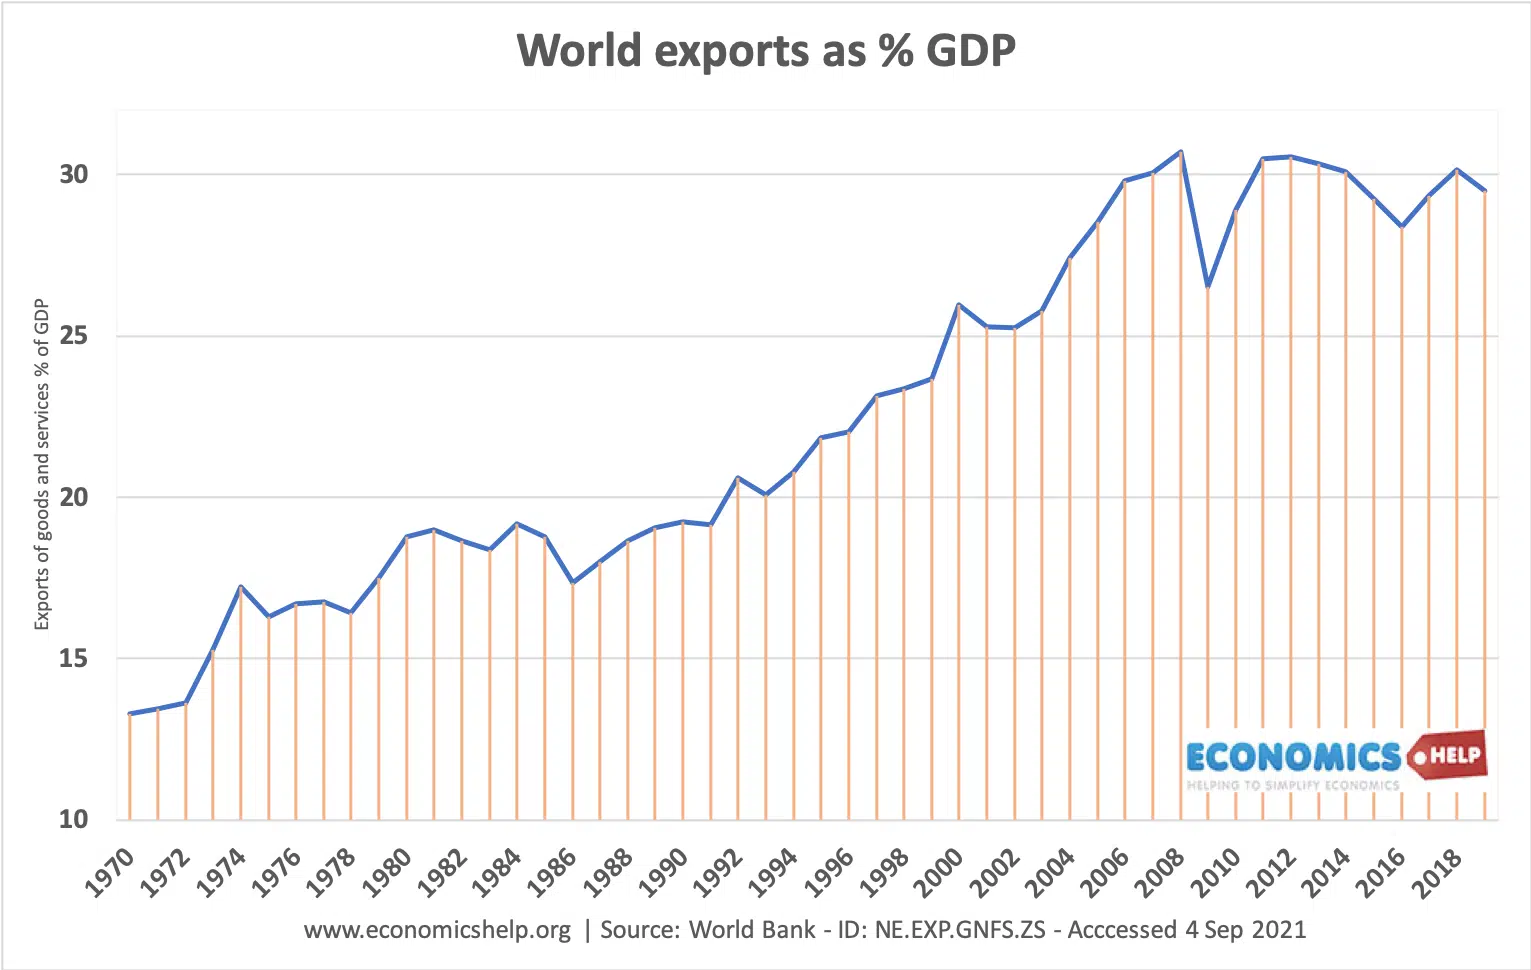
In recent decades globalisation has become so dominant, that we often assume the process is never-ending. Between 1970 and 2008, world exports as a share of GDP rose from 13% to 31%, and it seemed that globalisation was an unstoppable force.
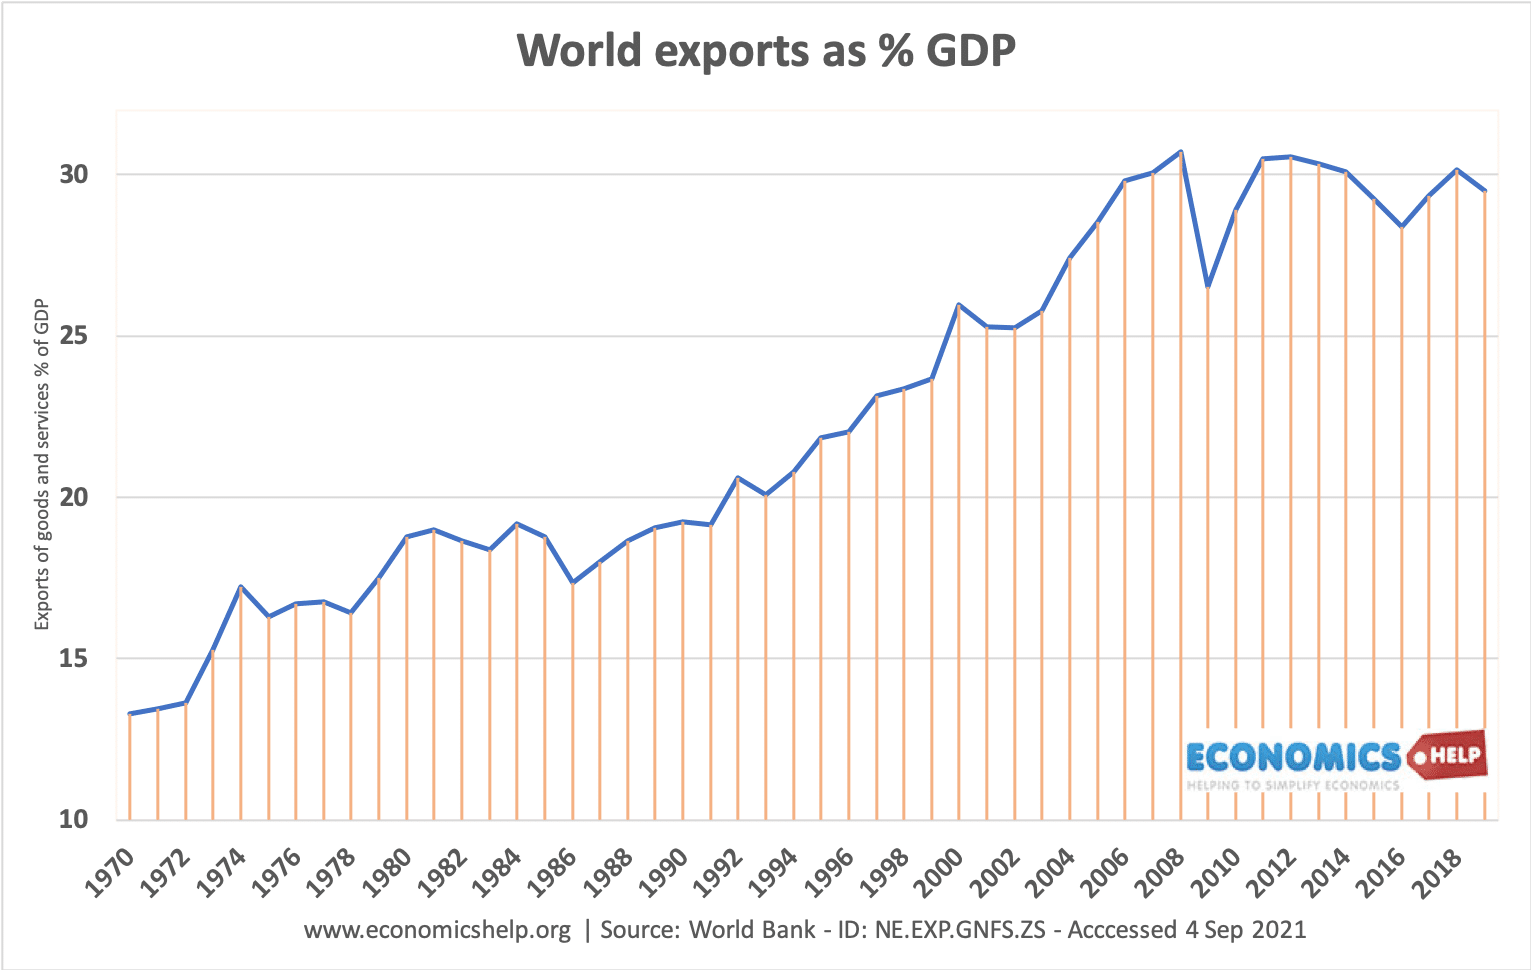
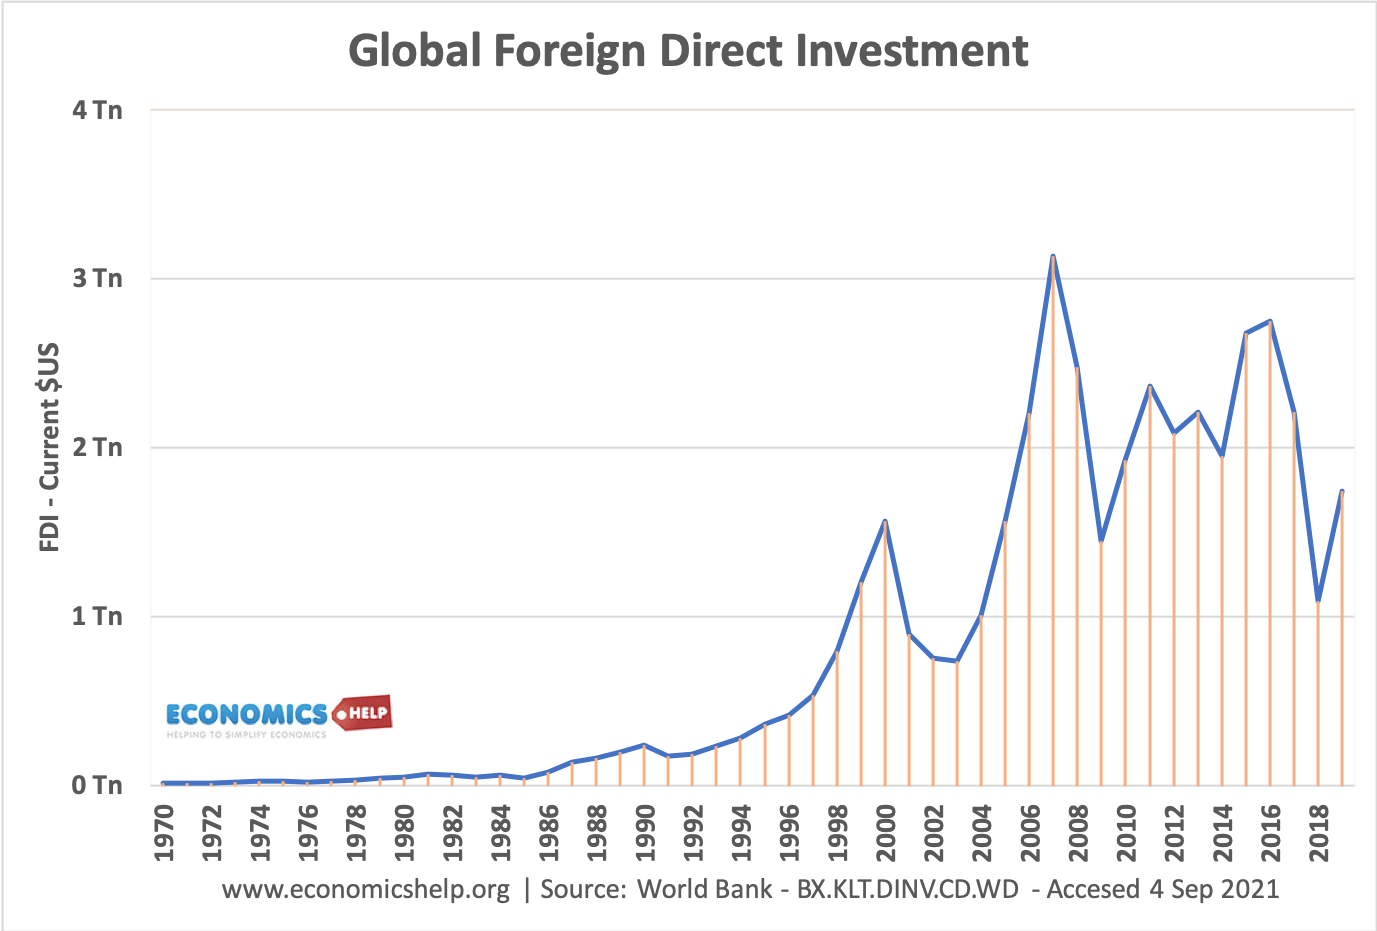
However, since 2008, something unexpected has happened. Exports as a share of GDP has flatlined and even started to fall. Other metrics show a similar fate, a fall in global bank loans, foreign direct investment has fallen quite sharply and multinationals share of profit has decreased.