Readers Question: Does the Rahn Curve support the empirical evidence? If not, why not? Can you prove that there is a relationship between the level of Government Spending and GDP growth?
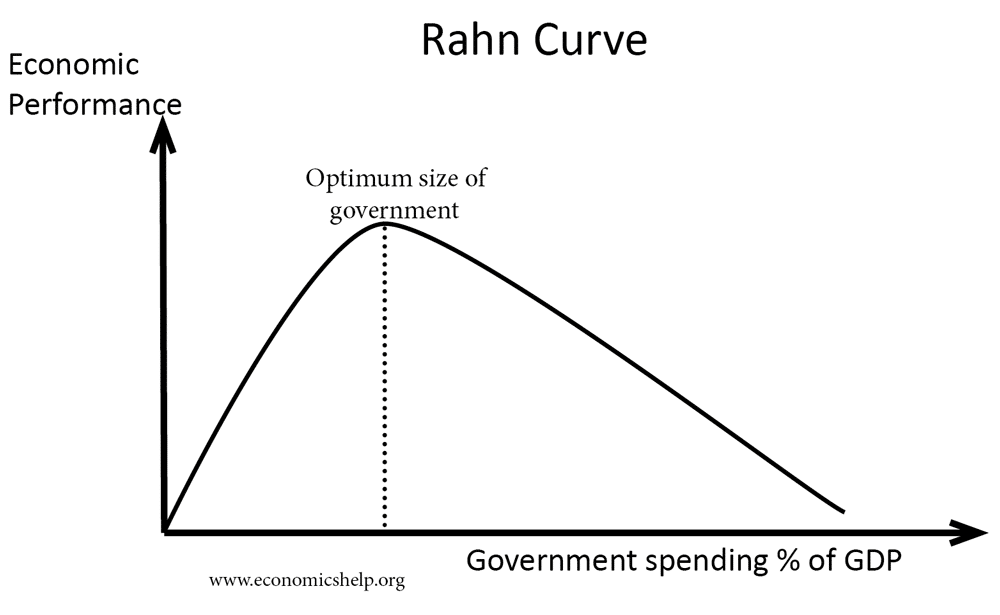
The Rahn Curve suggests that there is an optimal level of government spending which maximises the rate of economic growth. Initially, higher government spending helps to improve economic performance. But, after exceeding a certain amount of government spending, government taxes and intervention diminishes economic performance and growth rates.
Diagram of Rahn Curve
Reasons moderate levels of government spending increase economic growth
- Governments can spend on infrastructure ignored by free-market, e.g. road, railways. This helps to reduce the cost for business and improve productivity.
- Governments can support education which helps to increase labour productivity and economic growth
- Governments can spend money to provide law and order and help improve social and political stability which is necessary for economic growth.
Why government spending can start to hold back rates of economic growth
- Higher spending requires higher tax rates. Higher tax rates can create disincentives to work and disincentives for entrepreneurs to take risks.
- Higher government spending may crowd out private sector spending. Private sector spending and investment is likely to be more efficient because of the profit incentive to be efficient, whereas government spending is more prone to inefficiency and misplaced spending due to poor information.
- Nationalisation of key industries can lead to greater inefficiency due to problems of government managing business.
- A generous welfare state can create disincentives to work.
- Government regulation of industry can create additional costs to business.
How reliable is the Rahn Curve?
- Be wary of ideological preferences. Proponents of the Rahn curve tend to use it as a tool to argue that beyond a certain level – high levels of government spending hinders economic growth. For example, the Centre for Freedom and Prosperity [link] point to empirical studies which suggest that the optimal level of government spending for economic growth is between 15 and 25% of GDP. That page also shows links to other reports and empirical studies which would be worth investigating for your paper.
- The Centre for Freedom and Prosperity has a clear ideological stance that they dislike government spending. It is not surprising they highlight studies which show results favourable to their belief in reducing the role of government.
Catch-up effects. When countries are in a certain stage of development growth tends to be higher and government spending a smaller % of GDP. However, this does not necessarily prove the high growth is caused by low spending. A more convincing explanation would be that at certain stages of development it is easier to maintain high growth rates (e.g. China and India) because countries can easily catch up – by adopting technology from advanced economies. And it may be that these growth rates could have been even higher if the government had invested in infrastructure improvements.
Government spending can be of different types. To say that the optimal level of government spending is 20% is like plucking a figure out of the sky. It depends on what the government spends its money. If the government is spending money on generous benefits for the unemployed it is unlikely to be boosting growth rates. If the government is spending money on overcoming market failures such as providing education, training and infrastructure improvements then these can be helpful in increasing growth rates. Some argue with ideological fervour that government spending is always ‘inefficient’ But, this is lazy economics; some government spending can be inefficient, but, there is no reason why it has to be always inefficient.
Cherry-picking of data. Trying to find a link between economic growth and government spending makes it tempting to ‘cherry-pick data’ It is always easy to find particular examples of high growth with either high/low government spending.
Many factors affecting economic growth. Economic growth is determined by confidence, infrastructure, political stability, education, skills, the attitude of workers/entrepreneurs, technological development and many more. The point is levels of government spending is one minor factor out of very many. So it becomes very difficult to prove empirical links – there are too many factors involved.
Conclusion
I am rather dubious of the Rahn Curve; there are too many difficulties in deciding whether the level of government spending can influence the rate of economic growth. It would be more useful to examine whether particular government spending decisions have an impact on growth.
There is also another issue which can get lost – the fact that maximising growth rates is not necessarily the government’s highest priority. Issues of equity, fairness and concern for the environment are arguably more important than maximising rates of economic growth.
Real GDP per capita and government spending
Real GDP is different to economic growth. Economic growth is the rate of change of real GDP. But, it is worth having the perspective of living standards as this matter more to individuals than economic growth.
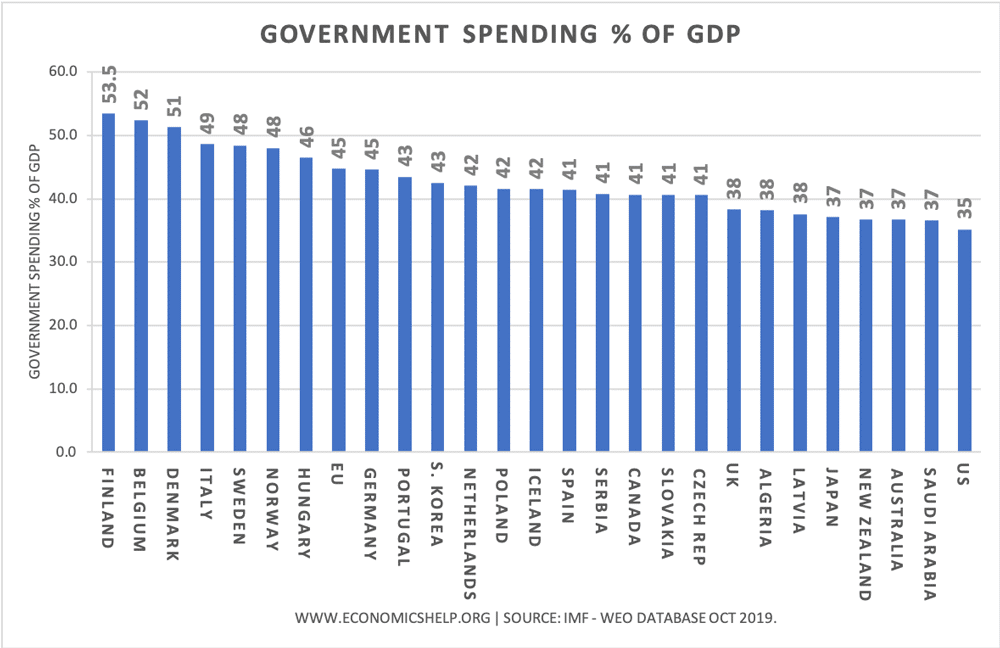
- Government spending in the US is approx 35% of GDP, in UK approx 38% of GDP, in western Europe, some countries have more than 50%.
The countries with the lowest rates of real GDP tend to be the poorest.

Quality of life and government spending
Countries with the highest quality of life index tend to be those who have the highest levels of government spending as a % of GDP.
Developing countries with the lowest levels of quality of life tend to have lower levels of government spending as a % of GDP.
Quality of life index

Optimal Levels of Government Spending
Nevertheless, it is still worth considering the optimal levels of government spending.
- For example, increasing state benefits will at some point have a trade-off of lower economic growth.
- A current issue is the level of state pensions and the optimal age for retirement, reducing state pensions (making people work longer) will probably lead to lower government spending and higher rates of economic growth.
- Another interesting question is whether there is a case for the government being involved in any industry. Does privatisation increase growth rates or can governments own public services like rail, health and education without compromising economic growth
Related
Large government are bad for growth because growth is not its number one priority
i want to know about the large gorvernment are bad for growth?
question is the south africa gorvernment arbnomally large or should its role be increased
The RAHN is logically correct.
First: It is obvious that Anarchy (0% Government), nor Communism (100% Government) promotes growth.
Second: The Economic system is the chosen method for decision making:
Anarchy (Somalia, Sudan, Afghanistan) transitional lack of government usually occurring during civil war or revolution
Capitalism (free markets- Dubai, Singapore)- allows everyone to participate in making economic decisions
Socialism (France, Germany)-the ruling class makes the economic decisions
Communism & Theocratic (Russia, Saudi Arabia, Iran)- the elite political party makes all economic decisions
Dictatorship- (N Korea, Zimbabwe, Nigeria, Myanmar) one person essentially making all economic decisions
Abundant empirical evidence confirms that economic growth follows the RAHN.
No! The Rahn curve is NOT logically correct!
As I pointed out here:
http://cantab83.blogspot.co.uk/2013/04/the-big-lie-2-small-govt-higher-growth.html
The Rahn curve logic is derived from that of the Laffer curve (tax receipts vs tax rate). Yet the two are not comparable.
Each is based on three postulates.
Postulate #1: 1st point on curve is zero
If tax rates are zero, then government tax revenues are zero (1st point on the Laffer curve). TRUE.
But zero government spending does not mean zero growth. An economy that is 100% private sector will still have competition and entrepreneurship. So the first point on Rahn curve is not zero. So FALSE
So Postulate #1 is true for the Laffer curve but not for the Rahn curve.
Postulate #2: Last point on curve is zero
If tax rates are 100%, then government tax revenues are zero because there is no incentive to work (last point on the Laffer curve). Actually this is not strictly true as I point out in link above, but most people assume it is.
For the Rahn curve: Well a communist country can still have growth as well. The Soviet Union grew under Stalin’s 5-year plans. So this postulate is FALSE for the Rahn curve.
So Postulate #2 is false for both the Laffer curve and the Rahn curve.
Postulate #3: The Curve is always positive
The tax revenue is always positive so the Laffer curve is positive for all tax rates between 0% and 100%. As it is zero at 0% and 100%(?) then it must have a peak in this range. This is probably true as productivity and tax revenues will be low for tax rates of 100%.
For the Rahn curve: The growth rate does not need to be positive, and it is not zero at the 0% and 100% end-points. so FALSE
The Rahn curve needs to pass all three postulate tests to be logically correct and to have a peak at some point along it (as the Laffer curve does), yet it fails all three tests. So it is logically flawed.
There are other problems with the Rahn curve, though, as well.
Why should a country’s growth depend only on the size of government spending, but not on how the government spends its taxes, or how much private sector investment there is, or on levels of personal consumption?
Why should the peak in the Rahn curve (if there is one) be at the same point for all economies irrespective of their state of development, or their balance between manufacturing, finance, services, agriculture and mining?
Moreover analysis of current and historical data provides ample evidence that Big Government promotes higher growth.
See here:
http://cantab83.blogspot.co.uk/2013/04/the-big-lie-2-part-2-small-govt-higher.html
There may be a Rahn curve for each country, but it is likely to be different for each country, to vary with time, and to change as the economy changes.
The article does nothing to answer the question of whether empirical evidence supports the Rahn Curve, but only postulates on why it might NOT be accurate – without empirical evidence to support the criticism.
I looked at empirical evidence for the United States, the European Union – 15, and China for the last 15 years, and the growth rates appear to be very consistent with the predictions of the Rahn Curve. While it may have some minor fluctuations over time, it does appear to be supported by empirical evidence historically.
There are many developing countries, other than China, with smaller governments and much larger growth rates than both the USA and UK: Brazil and India for example. But their growth has nothing to do with smaller governments.
These countries have higher growth-rates because they are playing catch-up with the US and UK. They don’t have to “re-invent the wheel” because other countries (like the USA and UK) have already done that for them. They can copy our ideas and technology without having to go through the trial and error of inventing them for themselves.
Also, their growth is not constrained by the limited demand of their own consumers because they can piggyback on the higher spending capacity of consumers in more developed countries. And their governments are small because the disposable income of their citizens is small and so their tax base is small. Therefore the economies of these countries contain no lessons from which we in advanced economies can learn.
As for the historical evidence, both the USA and the UK have had far higher growth rates over the last 60 years when government spending was more than 35% of GDP than they did in the entire 60 years prior to 1930 when their governments were less than 15% of GDP. And even if you just look at contemporary data the evidence suggests a positive correlation between government spending and growth. Over the last 20 years high spending Scandinavian countries have out-performed lower spending Anglo-Saxon economies. For all the data see here:
http://cantab83.blogspot.co.uk/2013/04/the-big-lie-2-part-2-small-govt-higher.html
So much for the Rahn theory!
Governments role is NOT “equity, fairness and concern for the environment”. Govenrment”s role should be limited to providing for the common defense and creating a general legal environment where citizens are reasonably assurred of the outcome of their decisions. Any thing other than that reduces personal freedom and leads to enslavement by the government. Regardless of how magnaimous the intent.
Also the author was afraid to answer the question.
The Rahn curve also explains why the US is currently in a state of decline after 200 years of explosive economic growth and growing world power. Welfare spending ticked sharply upward in the 1930s and as a result, GDP and productivity drop, and government spending is a higher percentage of the economy. This pattern was repeated 30 years earlier in England, which used to dominate the entire world prior to 1900, but when Socialism and Transfer spending took over the economy, the nation began a rapid collapse that accelerated after the world wars. The author needs to explain the strong correlation between economic collapse and government spending. Exibit B would be Zimbabwe, formerly Rhodesia.
“If the government is spending money on overcoming market failure such as providing education, training and infrastructure improvements then these can be helpful in increasing growth rates.”
To the extent this may be true, these government expenditures are within the 15%-25% optimal figure for expenditures.
The Rahn Curve provides empirical evidence to support a very simple concept – That each additional dollar taxed and spent by the government (although perhaps with good intentions) is another dollar that cannot be invested by the private sector in creating economic growth and jobs, thereby depressing economic growth.
I have yet to see any examples wherein significant economic growth is a BAD thing.
“The Rahn Curve provides empirical evidence to support a very simple concept – That each additional dollar taxed and spent by the government … is another dollar that cannot be invested by the private sector in creating economic growth and jobs…”
Oh dear!
Not every dollar that is earned by the private sector is invested to create economic growth and jobs. Much ends up being used for speculation and inflating asset bubbles, which then burst and cause recessions.
Far better the government spends that money instead.
“here are too many difficulties in deciding whether the level of government spending can influence the rates of economic growth.”
To test this out how about we pretend that I am the government and you my citizen. You give me all your money as a mock 100% taxation experiment. We will see how long you continue working under these conditions producing products that grow our economy. If you don’t feel your job is worth working for 0% pay and cease to do so then you will have proven if “government spending can influence the rates of economic growth”.
“There is also another issue which can get lost – the fact that maximising growth rates is not necessarily the government’s highest priority. Issues of equity, fairness and concern for the environment are arguably more important than maximising rates of economic growth.”
Not in the long term. Because growth compounds over time. Thus a country with yearly growth around 1.7% (say, Europe) becomes only half as prosperous as one that grows at 4% (the world average) in a mere 30 years. In light of this reality, the Welfare State does not seem that compassionate, does it?
In other words, in a country with 1.7% growth, after 50 years the top 30% of the population is as prosperous as the bottom 30% in a country that grows at 4.5%. That is hardly compassionate towards future generations. Of course, with birth rates of 1.3% countries like Spain and Greece do not have future generations to speak of, and this is why the long term argument is an even harder sell in these countries come election time.
“…birth rates of 1.3%…”
I meant
“…birth rates of 1.3 children…”
The Rahn Curve is a distorted, ideologically driven theory.
Less well-off societies tend to grow faster because they are catching up with the leaders and can use their technology. Better off societies, which tend to care more about individual welfare, health and the environment etc. and so have high public spending. They also tend to be slower growing because they are at the technological forefront and have already taken advantage of most of the more easily available advances.
Just look at the levels of human wellbeing in countries like Denmark, The Netherlands and Luxembourg and tell me they are suffering from too high a level of government spending. The Rahn Curve is simply rubbish!
“There is also another issue which can get lost – the fact that maximising growth rates is not necessarily the government’s highest priority. Issues of equity, fairness and concern for the environment are arguably more important than maximising rates of economic growth.”
No. This is unquantifiable gibber.
Maximising economic growth time consistently or wealth is a valid goal. It should be the prime economic objective. Properly considered, it addresses equity and environmental concerns.
Rob C is right about developing nations catching up. He’s wrong about why developed nations are wealthy though.
They didn’t become wealthy through expansive and inefficient Government. They followed high growth, low tax regimes in the first place. This largesse they currently enjoy is simply a luxury the electorate is divesting out of future productivity. Univerisites in Europe have been around for centuries. Decades of redistribution did not deliver the rich academic heritage they now have.
the rahn curve is correct..when the economy is in the recession as implemented by john maynard keynes..the government can use its fiscal policy to stabilise the economy ..which is expansionary policy..which says either increase in goverment spending or decrease in tax rate(let us focus on increase in govt spending)govt will increase its spending to increase aggregate demand in the economy which will in turn improve the gdp growth..when the situation(recession)is defeated then govt adopt contractionary fiscal policy to reduce its spending ..to balance the economy…