
Readers Question: Could you please help me understand why high debt as a big percentage of GDP is bad, or at what point does it becomes bad? Japan is at something like 234%, and the UK at 500% (counting all debts and liabilities). Both countries are still waking up every day and going about business (I guess). What do those comparisons of debt to GDP actually tell me?
Firstly, the statistic for UK at 500% looks like UK external debt. Or more likely it could refer to the total UK debt i.e. Private + Public debt. See: UK Total Debt.

234% is Japan’s government debt. It is the highest level in the world At the moment, Public sector debt in different countries is:
- Japan 234% of GDP
- UK 101% of GDP (2025) (excluding financial sector intervention
- US 120%
- Spain 101% (2024
- see: list of debt by Country
What Debt Levels Are Dangerous?
- Above 60% of GDP. Government debt above 60% of GDP would be considered to be problematic. 60% is somewhat arbitrary, but it was chosen for the Maastricht criteria.
- Above 100% of GDP. This is another warning statistic. Once debt increases above 100% of GDP, it becomes a bigger cause for concern. It can also lead to lower levels of growth (See: IMF blog). Though it is also both ways – lower growth leads to higher debt
- When debt interest payments as a share of GDP are rising rapidly
Generally higher debt levels are potentially more problematic. As debt to GDP rises, ceteris paribus markets are more likely to be concerned and be less willing to buy debt. Therefore, as debt to GDP rises, interest rate rises. Therefore, the governments interest bill can increase.
Other factors that make debt dangerous
Debt interest payments. If a country pays a steady 3% of GDP on debt interest payments, then this is a sustainable level. But, if the share of GDP and tax revenue going to debt interest payments increases, then this is a problem because if a country has difficulty paying debt interest payments, it can create a cycle of rising bond yields, higher debt payments and need to cut spending, which could lead to lower growth.

This shows UK debt interest payments rose from 2% to 4% within a two years because of high inflation and rising bond yields. This makes high level of debt more expensive to pay.
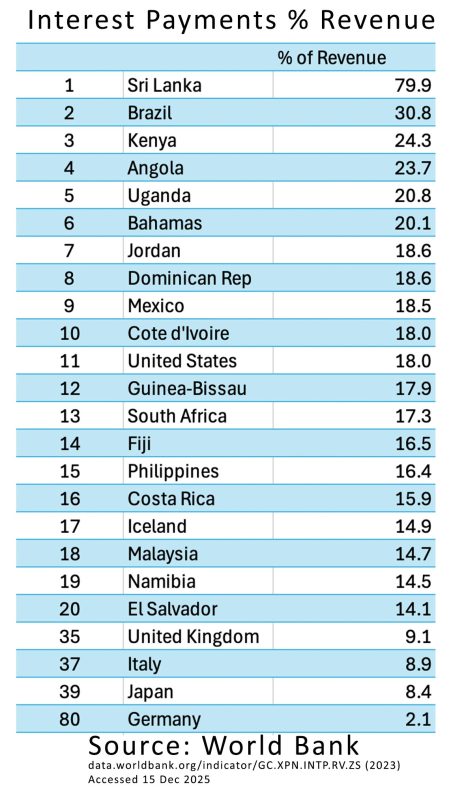
This shows the share of government revenue that are spent on debt interest payments
Source: World Bank
This shows that in 2023, Sri Lanka was struggling with severe economic crisis. A result of deep crisis, devaluation and fall in export revenue. It required IMF bailout. But, in a way this gives a better guide to the affordability of debt than actual debt levels
Rate of Economic growth. If your debt increases by 5% a year, but you have economic growth of 5% a year. Then you are stabilising your debt to GDP ratio. If your debt increases by 5% a year, but you have negative economic growth of -2%, then your debt to GDP ratio is increasing by 7% a year. Clearly, economic growth is a key factor in determining debt to GDP. GDP growth is just as important to actual debt levels.

This shows a fall in the trend rate of UK economic growth. With lower growth it becomes harder to keep on top of debt and debt interest payments
Rate of Increase. At the start of the Euro crisis, countries like Spain and Portugal had low debt levels. However, a budget deficit of 10% of GDP, meant total government debt increased very rapidly.
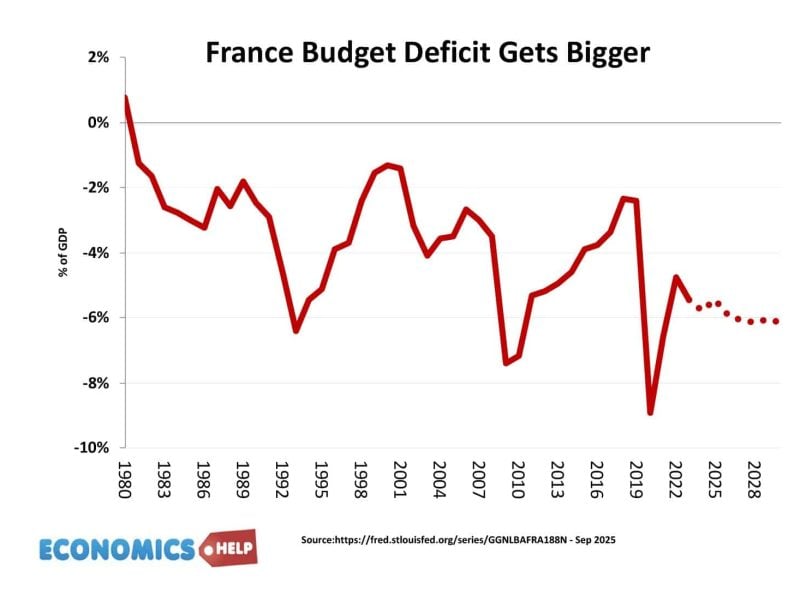
This shows the continued increase in the French budget deficit. It is a concern to have a deficit of 6% – even without an economic crisis.
Liquidity. Countries in the Euro have proved much more susceptible to rising interest rates. The UK has benefited from having a Central Bank willing to create money and buy bonds. This keeps interest rates low and gives markets confidence there will be no liquidity crisis. But, Euro countries don’t have this. If investors don’t buy enough bonds, there is no guarantee a Central Bank will deal with a temporary liquidity crisis. This is one reason why Euro countries have been susceptible at even relatively low debt to GDP ratios.
Demographics
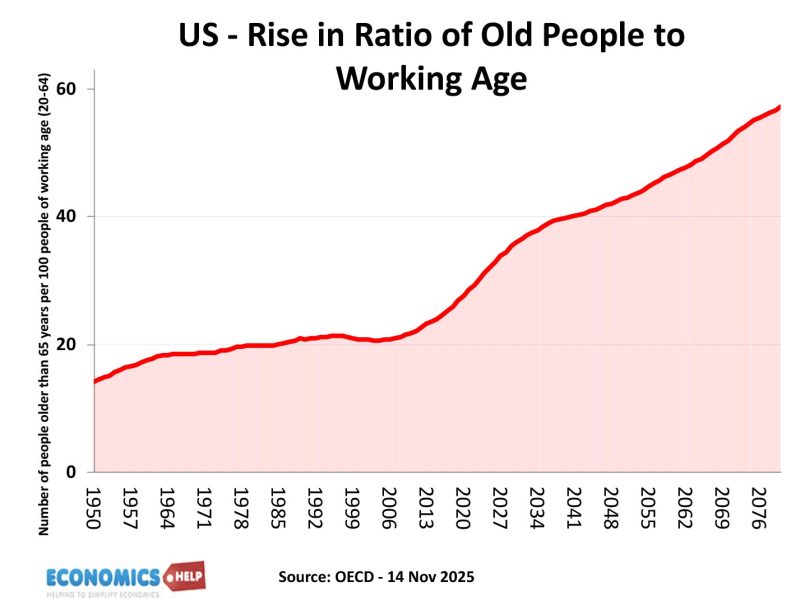
The problem many advanced economies face is that with an ageing population, the government is set to spend more on automatic spending – pensions, health care. At the same time, tax revenues are set to stagnate because of relatively fewer workers and slower growth
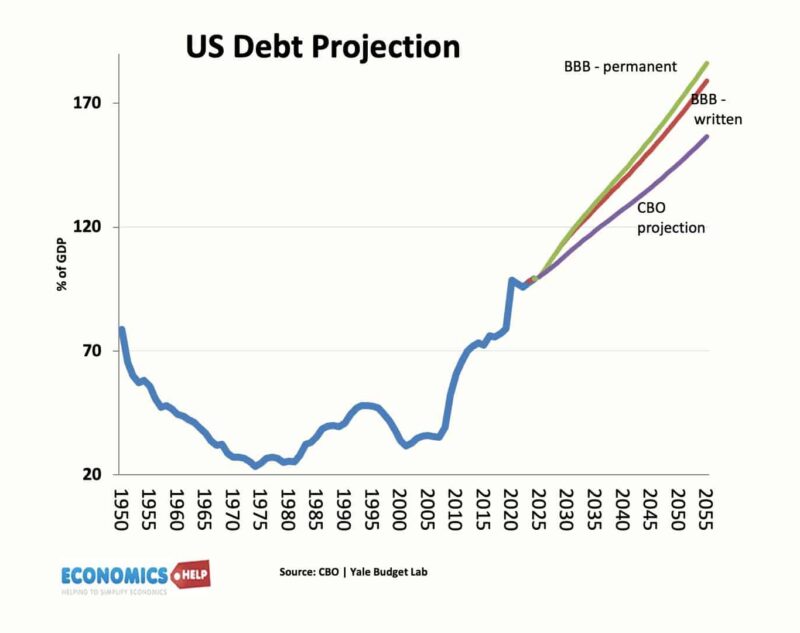
The forecast rise in US debt mirrors the forecast rise in the old-age dependency ratio.
Total debt – Private + Public Sector Debt
If private debt is low and private savings high, it is much easier for the government to borrow. If the private sector has high levels of savings, they will be willing to use their savings to buy government bonds at low interest rates. However, if private sector savings are very low, who is going to buy government debt?

This shows how government debt is balanced by a surplus in the private sector.
High levels of Japan government debt were partly a response to high levels of Japanese domestic savings.
Often in a recession, private sector saving rises, government borrowing is a way of soaking up this rise in private saving and injecting money into the economy. Therefore, a rise in government debt during a recession is less of a concern than during high growth.
External Debt/Assets
External debt could be an issue. The UK has high external debt (though also high external assets). But, if there is a rapid fall in the value of its external assets it could be vulnerable. In the case of Japan, the government debt of 236% looks worse than it is, because the Japanese government has substantial overseas assets which give annual return. The net liabilities of Japan are closer to 130% of GDP. (History of National Debt in Japan)
Reliance on Foreign Funding
About 30% of UK debt is financed by foreign banks. If you rely on foreign funding of government debt, you might be more susceptible if foreign countries fear a devaluation in your currency.
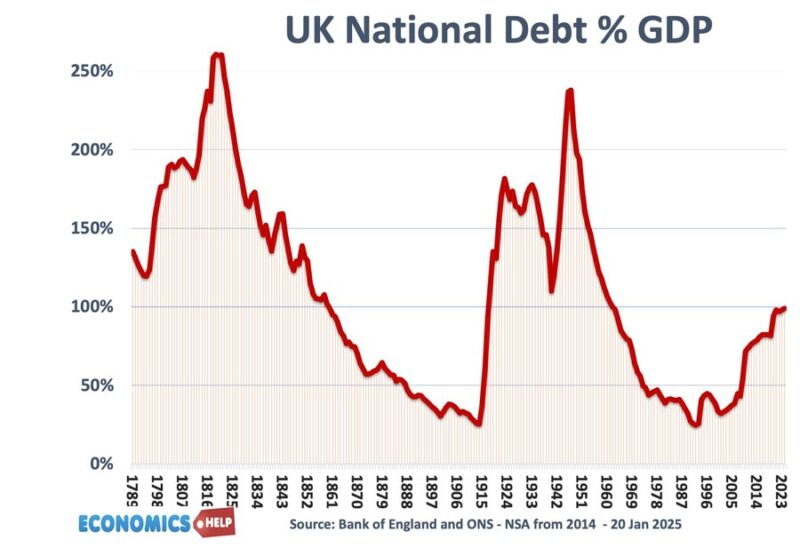
Also, if you look at historical national debt, the UK has had much higher debt levels. In the early 1950s, UK debt was over 230% of GDP. Does that mean the UK could triple its current government debt? Well, probably not. Circumstances are different in 2025 to the early 1950s.
From these statistics, you might expect Japan to be in the greatest difficulty because it has by far the highest levels of debt.
Yet, markets are not really concerned about Japan public sector debt levels. Bond yields on Japanese government debt were very low (though in 2025 have started to rise, and this is a problem for Japan in the future). See: Why can Japan borrow so much?
Rising Bond yields

Rising bond yields increase the cost of debt interest payments
Note: If markets fear a government is borrowing too much (if they fear the government may become insolvent or illiquid) then they will sell these government bonds. Selling bond yields pushes up the interest rate.
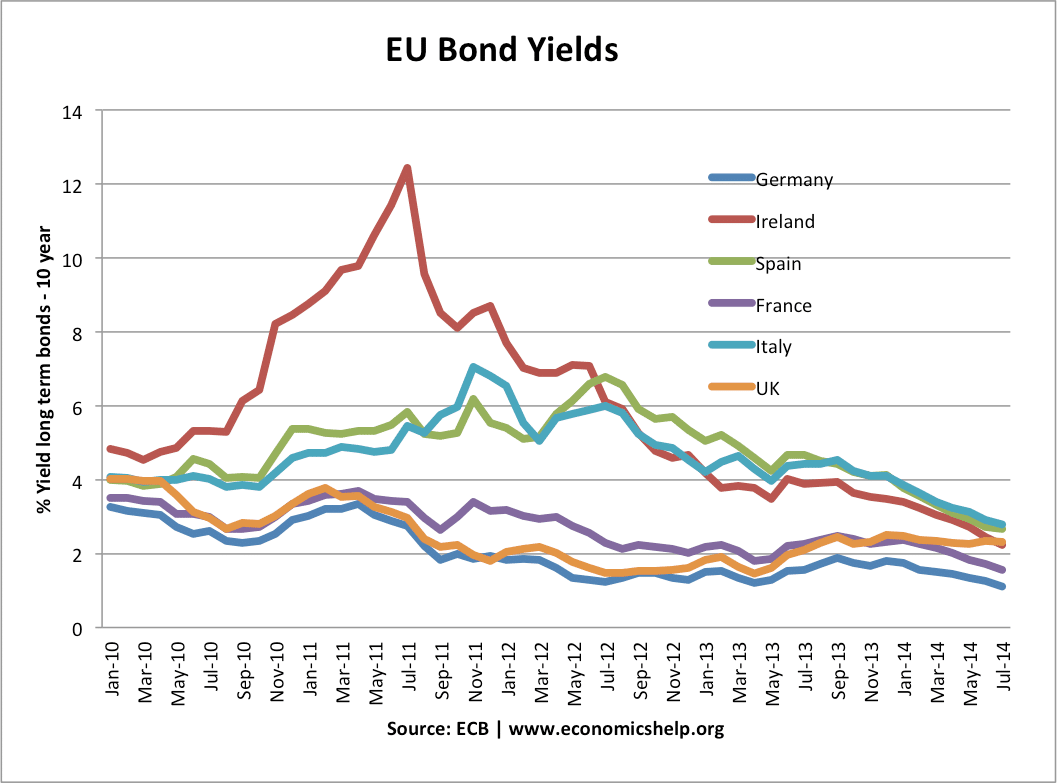
In 2011, Euro countries like Ireland saw a spike in bond yields because of fears over liquidity. This required Ireland to pursue austerity – cut spending and increase taxes.
Higher bond yields are a sign that the debt is considered risky. In other words, markets need a higher interest rate to compensate for the increased risk.
Should we worry about UK Total debt of close to 500% of GDP?
Yes, it is very high. It tends to indicate lower growth as the government and the private sector try to reduce debt levels. It also depends on the type of debt. Debt secured by the value of a house is less risky than say borrowing on credit card.
Video
Related
About The Author

debt only lowers growth IF the government and private sector try to reduce debt levels…if they keep borrowing, you have no problem, because all debt on one balance sheet is an asset on someone else’s…