Stats on EU Bond Yields and Debt.
See also: Primary budget Deficits of EU
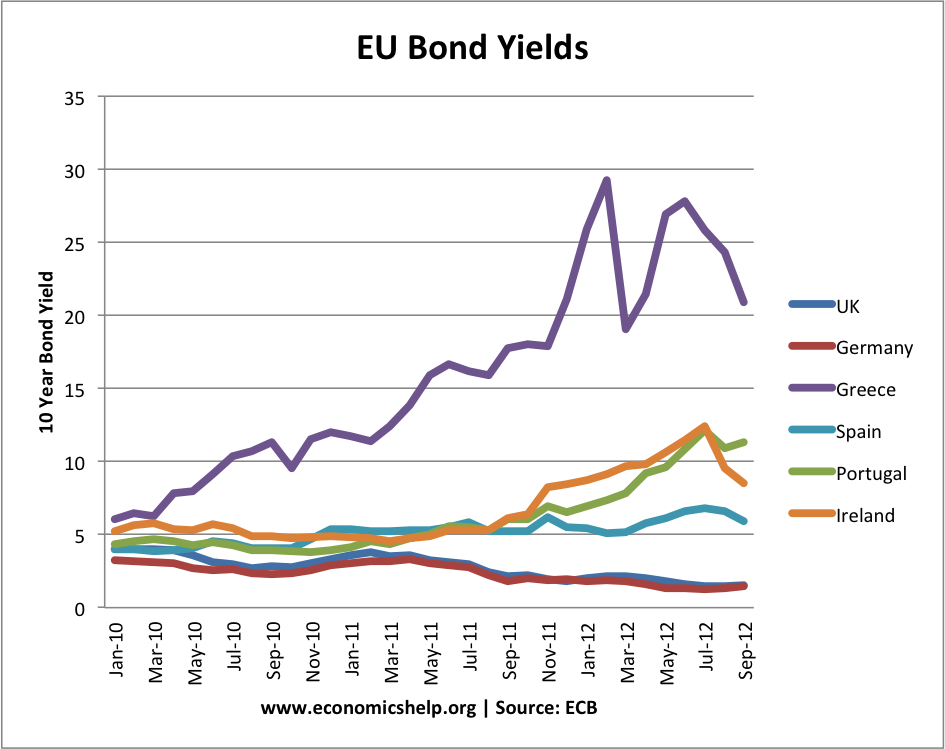
EU Bond yields 2010 – 2012
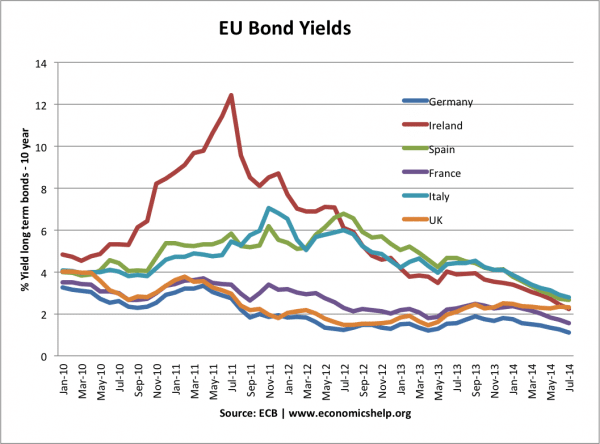
EU Bond Yields 2010 – 2014
2010-2012 – Why did Bond yields on Eurozone debt rise, but yields on UK debt fall?
One significant cause is that the ECB won’t / can’t act as lender of last resort and buy government bonds. Therefore markets fear a liquidity shortage in Eurozone and so are reluctant to hold bonds.
Further reading: EU debt crisis explained
Related
See also:
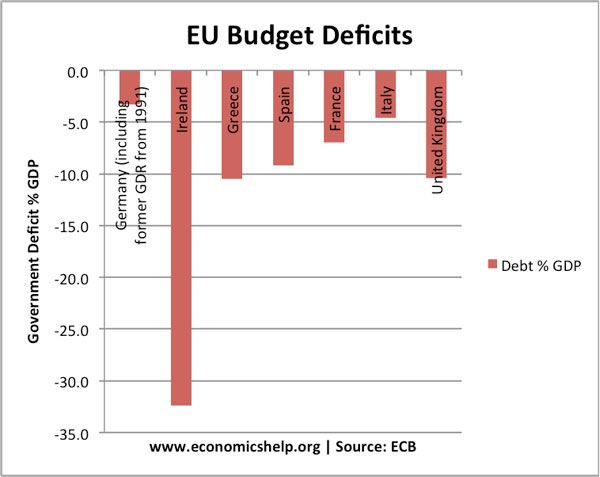
EU Budget Deficits (2010)
Source: EU Budget Deficit
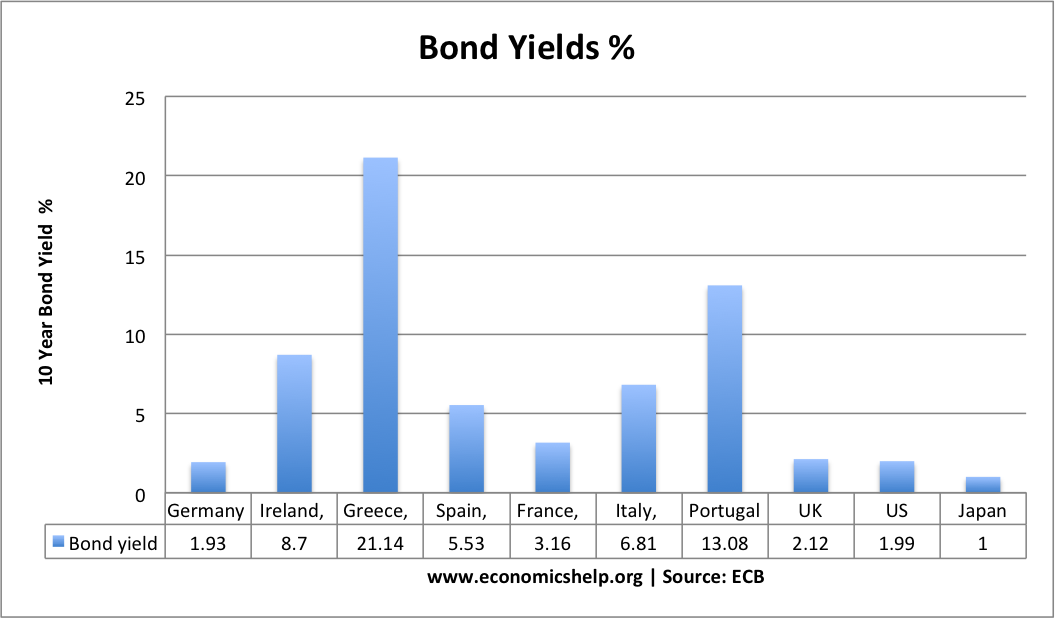
Interesting point: UK bond yields are as low as Germany (2.3%). Yet UK has higher government deficit than Italy and Spain.
Budget Deficits 2012
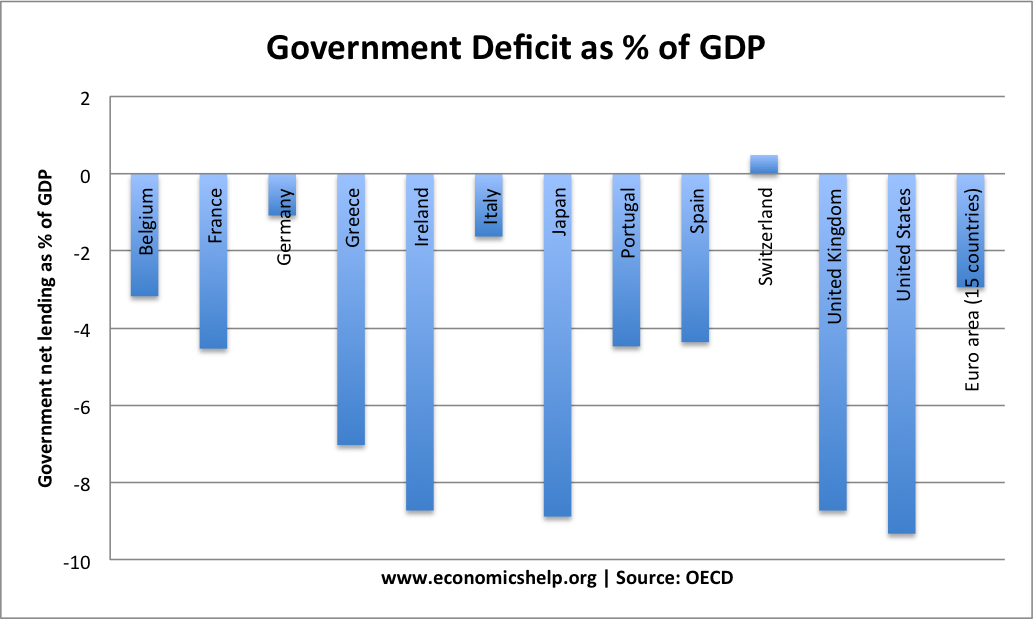
Highest budget deficits – Ireland, Japan, UK and US
OECD – Budget deficits 2012
10 Year Bond Yields
| GEO/TIME | 2010 | 2004 | 2005 | 2006 | 2007 | 2008 | 2009 | 2010 |
| Germany | -3.3 | -3.8 | -3.3 | -1.6 | 0.3 | 0.1 | -3.0 | -3.3 |
| Ireland | -32.4 | 1.4 | 1.6 | 2.9 | 0.1 | -7.3 | -14.3 | -32.4 |
| Greece | -10.5 | -7.5 | -5.2 | -5.7 | -6.4 | -9.8 | -15.4 | -10.5 |
| Spain | -9.2 | -0.3 | 1.0 | 2.0 | 1.9 | -4.2 | -11.1 | -9.2 |
| France | -7.0 | -3.6 | -2.9 | -2.3 | -2.7 | -3.3 | -7.5 | -7.0 |
| Italy | -4.6 | -3.5 | -4.3 | -3.4 | -1.5 | -2.7 | -5.4 | -4.6 |
| United Kingdom | -10.4 | -3.4 | -3.4 | -2.7 | -2.7 | -5.0 | -11.4 | -10.4 |
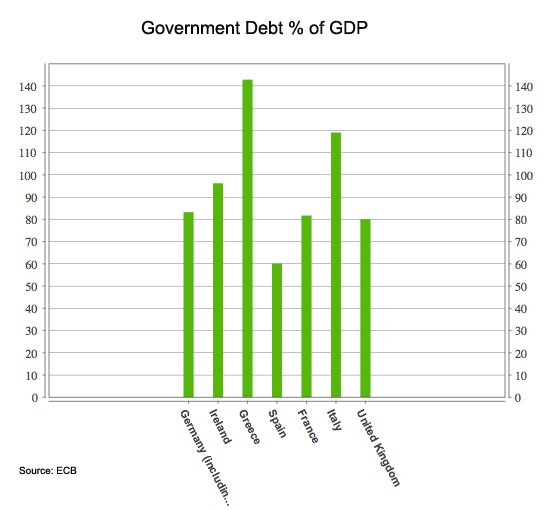
Gross Government Debt
Source: ECB

6 thoughts on “EU Bond Yields and Debt”
Comments are closed.