Impact of deflationary fiscal policy in UK

A report by NIESR suggests that austerity pursued by the government in 2010, needlessly led to a delayed economic recovery and could have cost the UK 5% of GDP or £1,500 per person.

economic-growth-quarterly

The austerity was unnecessary because

  • The lower growth led to delayed rises in tax increases and
  • Interest rates were at 0%, and demand for government bonds high.
  • By delaying budgetary changes until the recovery was stronger, the government could have avoided a double dip downturn and still be able to reduce debt to GDP in the long term.

The impact of the deflationary fiscal policy could have been worse if:

  • The government had stuck to its initial austerity targets for cutting spending even more over the first Parliament
  • If the Bank of England had not used monetary policy to offset the decline in aggregate demand.


“The delay in the UK recovery over the first part of the coalition government’s term is at least in part a result of the government’s fiscal decisions. I have argued that these decisions were a mistake… It will be many years before we can settle on a figure for the total cost of that mistake, but measured against the scale of how much governments can influence the welfare of its citizens in peace time, it is likely to be a large cost.”

Professor Simon Wren-Lewis NIESR

Impact of discretionary fiscal policy

OBR
OBR October 2014

Implied discretionary fiscal change

Read more

Understanding Government Debt Statistics

There are a raft of different methods of calculating government debt. It can be a little bewildering (even for an economics teacher!). I have tried to define the key terms in a simple format and also a more detailed and precise way. This only focuses on the UK.

Defining Public Sector Debt

Simple Way:

  • Government Deficit – annual shortfall between spending and tax receipts. The amount the government have to borrow from private sector in a certain year. (see also: public sector net borrowing (PSNB) public sector net cash requirement (PSNCR), public sector borrowing requirement PSBR, net borrowing, cumulative public sector current budget)

budget-deficit-46-13 US Federal Deficit as % of GDP

  • Government Debt – The total amount the government owe to private sector (see: also, public sector net debt, national debt, GGGD). This is the accumulation of borrowing over many years.

uk-debt-100-years

Debt as a % of GDP

  • Debt can be expressed in nominal figures or as a % of GDP.
  • in Jan 2009, UK public sector debt was £697bn which = 47.5% of GDP

More Definitions

  • Public Sector Net Debt – Total Amount government (central, local and corporations) have borrowed from Private sector – liquid assets. Often referred to as National debt (e.g. in 2009, Public sector net debt was £697bn or 47.5% of GDP
  • Public Sector Net Cash Requirement PSNCR – The amount governments need to borrow in a year to meet its shortfall of spending and tax receipts. (e.g. in 2008-09 government has a PSNCR of about £115bn) Often referred to as annual government deficit. Used to be called PSBR (Public sector borrowing requirement).
    – The PSNCR is similar to net borrowing and government borrowing

Debts Not Related to Government Debt

  • Current account Balance of Payment deficit – Not related to public sector net deficit. current account deficit related to level of net imports
  • External debt – Total amount that UK owes foreign countries. External debt includes government liabilities + private sector liabilities; it is not directly related to public sector debt.

More Detailed Definitions

Read more

Deflationary Bias in the Eurozone

Readers Question: Is there an inbuilt deflationary bias in the Eurozone?

Note: I originally wrote this post in 2010. Unfortunately, every year there is a reason to update the post and suggest the deflationary bias in the Eurozone keeps getting stronger.

eu-inflation

Deflationary bias means that there is a tendency for economic policy to promote lower growth and lower inflation. It means there are pressures which keep demand subdued leading to lower inflation, higher unemployment and lower growth. Now, we are seeing outright deflation (fall in prices)

I agree that there is a deflationary bias in the Eurozone. This is proved by the long period of low economic growth (2007-15) and an inflation rate that is remaining well below target. Headline inflation in the Eurozone has fallen to -0.2% (Outright deflation, though core inflation, is still 0.7%). Growth is anaemic and unemployment well into double figures (11%) – Unemployment is higher in Europe than many other countries.

European Unemployment Eurozone vs Non-Eurozone economies

eurozone-unemployment

Source: Eurostat

Although core inflation is still positive. Many countries on the periphery are experiencing a real threat of prolonged deflation.

What explains the deflationary bias of the Eurozone?

Low Inflation Target

The ECB have very strong attachment to keep inflation less than the target of 2%. For example, in 2011, temporary cost-push inflation, led to an increase in the EU headline inflation rate. The ECB responded by increasing interest rates. The Bank of England responded by keeping interest rates at 0.5% (even though inflation was much higher in the UK than EU). The Bank of England argued it was important to give importance to wider economic issues of growth and unemployment. The ECB were much less willing to accept, even a temporary deviation from the inflation target over fears temporary inflation would increase inflation expectations. It showed the ECB are much more willing to risk lower growth than risk higher inflation. (see also: ECB v Bank of England)

Whilst the ECB have an inflation target, they have no explicit target for unemployment or economic growth. EU Unemployment has risen to 12%, but there has been little action to increase aggregate demand.

The ECB have worried than any unconventional monetary policy may reduce their credibility and long-term ability to tackle inflation.

Reluctance to pursue unconventional monetary policy

Despite a prolonged period of low inflation, the ECB have been very reluctant to actually implement unconventional monetary policy  (e.g. Quantitative easing). It took outright deflation to finally push the ECB into proper Q.E, in Jan 2015.

The ECB is reluctant to engage in any quantitative easing because

  • They are reluctant to create any possibility of future inflation, printing money is an anathema to German Central Bankers, who wield considerable influence over ECB monetary policy.
  • The ECB has a reluctance to start buying bonds of different countries, deciding which to buy; and there have been constitutional excuses for not printing money.

The result is that countries with many deflationary pressures (strong exchange rate, fiscal austerity) don’t have any monetary stimulus to offset the fall in demand. (e.g. UK can pursue quantitative easing when we experienced deep recession). Countries in Eurozone can not.

Read more

Greece austerity

Greece is a very good example of the damage of austerity can do to both economies and the social fabric of a country. Firstly Greek austerity is almost unprecedented in its scope and intensity.

Greece government spending and revenue

greece austerity
Source: Statista

Greek government spending was cut from €120 bn in 2008 to €90 bn in 2014.

To put that into context – the UK years of ‘austerity’ have seen government spending rise from to £522bn in 2007/08 to £722 bn in 2013/14 (UK government spending)

To cut government spending by 25% in nominal terms is quite rare. In addition, the Greek economy was also saddled with other difficulties which have contributed to lower economic growth.

  • Due to higher inflation rates, Greece experienced a decline in competitiveness . Because it was in the Euro it couldn’t devalue and this led to a large current account deficit – lower exports and reduced domestic demand.
  • No control over monetary policy. The ECB increased interest rates in 2011, and have, until very recently, rejected any form of quantitative easing to help boost domestic demand in southern Europe.

Cost of Austerity

The cost of this austerity has been enormous in terms of economics, social and political upheaval.

unemployment-greece

Source: wikipedia

Read more

Competitive Devaluation and Currency Wars

Competitive devaluation occurs when countries seek to reduce the value of their exchange rate to make their exports cheaper and gain a competitive advantage in world trade over other countries. This may encourage other countries to respond by also devaluing their currency to maintain their own competitive advantage. If countries are making great efforts to …

Read more

Why UK stayed out of the Euro

Why didn’t the UK Join the Euro? Joining the Euro would give the UK various advantages: predictability of exchange rates with Europe Easier for consumers to compare prices (price transparency) Lower transaction costs Encourages investment because of greater stability in trade. However, despite these potential benefits the UK decided not to join and shows no …

Read more

Interest Rate Predictions 2015

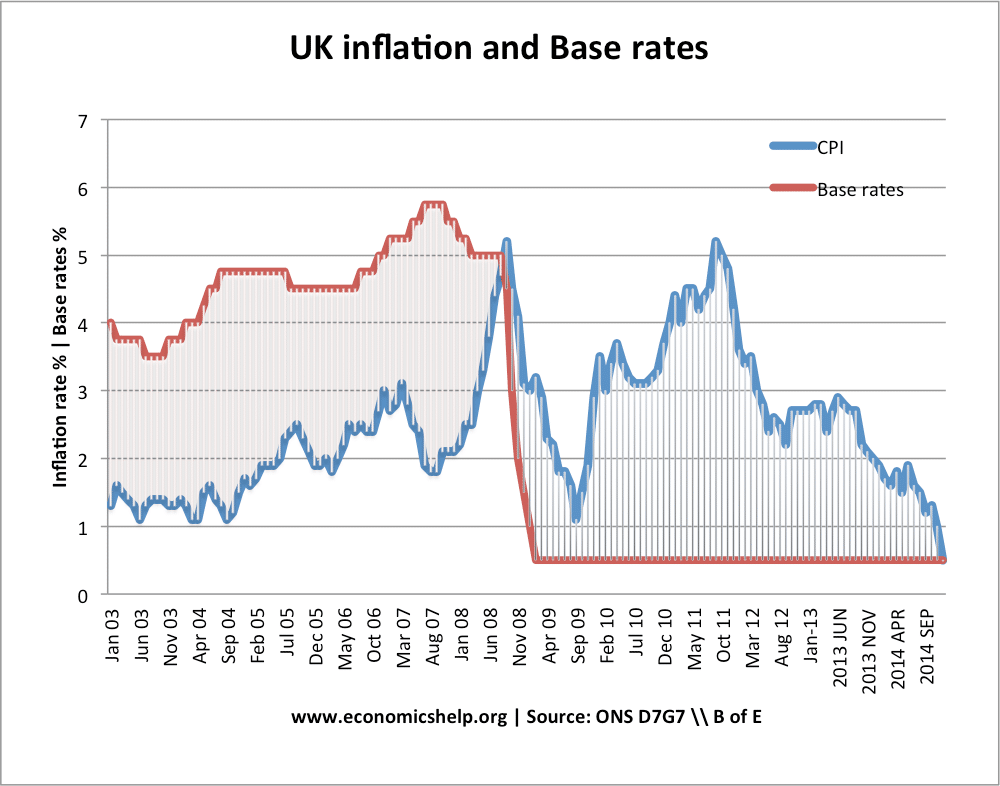
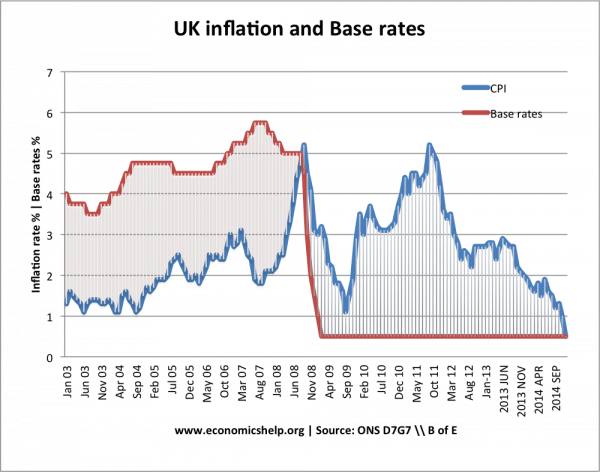
Bank of England base interest rates are currently 0.5%. Economists are divided about when interest rates will rise. Some point to the evidence of a strong economic recovery to suggest interest rates could rise by mid 2015. Others argue that the strong global deflationary pressures mean that UK inflation is likely to stay very low (currently 0.5%) and therefore interest rates will stay at 0.5% until even 2016.

inflation-base-rates-since-03

When interest rates were cut to 0.5% in 2009, few would have predicted that interest rates would have stayed so low for so long. In the past few years, expectations of rising interest rates have often proved a false dawn. The reasons for a rise in rates have later evaporated. Will 2015 be a similar experience with the long-awaited rise in interest rates delayed again?

Projections for interest rates (Nov 2014)

  • 2015 – 0.8%
  • 2016 – 1.4%
  • 2017 – 1.7%

The Bank of England inflation forecast from Nov 2014, suggests inflation is expected to continue to fall until 2017. They see no immediate rise in inflation.

bank-england-forecast

Latest Bank of England forecast Nov 2014

However since the latest Bank of England inflation report in Nov 2014, inflation has fallen more sharply than expected, and this could delay the time of rising interest rates.

Why are interest rates likely to stay at 0.5% until 2016?

Read more

UK Debt Burden

What is the UK’s debt burden?

Firstly, there are different types of debt to consider

  1. Government debt – See: public sector debt (often referred to as National debt)
  2. Private sector debt – indebtedness of householders, finance sector and non-financial companies.
  3. External debt – the amount we ‘owe’ to other countries

In addition, you might take into account – future liabilities, e.g. pension fund commitments. Also, equally important, is future economic growth, tax revenue and the ability to meet the current debt burden.

Debt  burden as % of income

The most useful way to consider the debt burden. Is to consider:

  1. Debt as a % of income.
  2. Also, the % of income / taxes spent on debt interest payments

Government debt

uk-national-debt
Source: Reinhart, Camen M. and Kenneth S. Rogoff, “From Financial Crash to Debt Crisis,” NBER Working Paper 15795, March 2010. and OBR from 2010.

UK government borrowing fell to record levels in the early 1990s, but since the financial crisis, national debt as a % of GDP has increased to 78% of GDP (2015).

A related to concept to total national debt is the budget deficit. The budget deficit is the annual amount the government is borrowing.

Debt interest payments as % of GDP

Another important consideration is how significant are debt interest payments.

debt-interest-payments-percent-gdo

With low interest rates, the cost of servicing the UK government debt is lower than we might expect. Many economists suggest that when interest rates are low, the government should take advantage and borrow to finance investment.

See also: UK Debt interest payments

The amount spent on debt interest payments is important for understanding the ‘debt burden’ If you take out a mortgage, the crucial thing is not the total amount outstanding, but the percentage of your income that is spent on mortgage monthly payments.

Who is the UK debt burden owed to?

Another important consideration is who does the UK government borrow from?

The majority of UK public sector debt is owned by the UK private sector / Bank of England.

Private sector debt

In addition to government debt it is also important to look at private sector debt. In particular household debt / company debt. For example, at the start of the recession, household debt fell because householders sought to increase savings and pay off their debts, due to low confidence. In this case the government borrowing is partly offsetting the rise in private sector saving.

total-uk-debt

Financial debt is more complicated. The UK tends to have a large share of financial debt as a % of GDP because it has a large finance sector. But, these large liabilities are offset by high financial sector assets. Financial sector debt becomes a problem if assets fall in value. (e.g. during credit crunch)

Read more

Item added to cart.
0 items - £0.00