What is the UK’s debt burden?
Firstly, there are different types of debt to consider
- Government debt – See: public sector debt (often referred to as National debt)
- Private sector debt – indebtedness of householders, finance sector and non-financial companies.
- External debt – the amount we ‘owe’ to other countries
In addition, you might take into account – future liabilities, e.g. pension fund commitments. Also, equally important, is future economic growth, tax revenue and the ability to meet the current debt burden.
Debt burden as % of income
The most useful way to consider the debt burden. Is to consider:
- Debt as a % of income.
- Also, the % of income / taxes spent on debt interest payments
Government debt

UK government borrowing fell to record levels in the early 1990s, but since the financial crisis, national debt as a % of GDP has increased to 78% of GDP (2015).
A related to concept to total national debt is the budget deficit. The budget deficit is the annual amount the government is borrowing.
Debt interest payments as % of GDP
Another important consideration is how significant are debt interest payments.
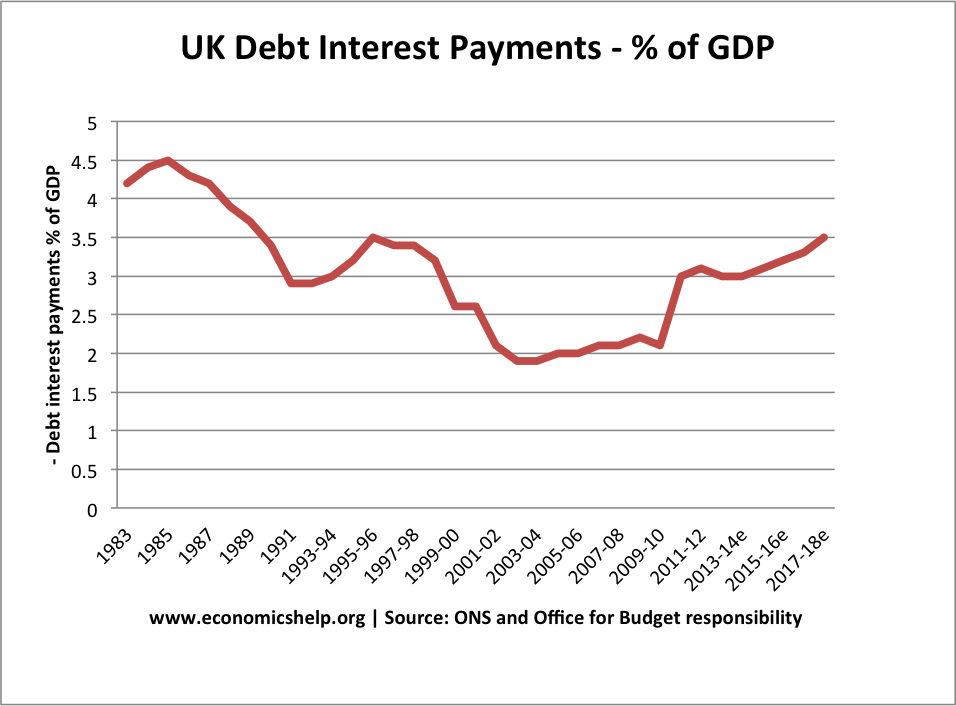
With low interest rates, the cost of servicing the UK government debt is lower than we might expect. Many economists suggest that when interest rates are low, the government should take advantage and borrow to finance investment.
See also: UK Debt interest payments
The amount spent on debt interest payments is important for understanding the ‘debt burden’ If you take out a mortgage, the crucial thing is not the total amount outstanding, but the percentage of your income that is spent on mortgage monthly payments.
Who is the UK debt burden owed to?
Another important consideration is who does the UK government borrow from?
The majority of UK public sector debt is owned by the UK private sector / Bank of England.
Private sector debt
In addition to government debt it is also important to look at private sector debt. In particular household debt / company debt. For example, at the start of the recession, household debt fell because householders sought to increase savings and pay off their debts, due to low confidence. In this case the government borrowing is partly offsetting the rise in private sector saving.
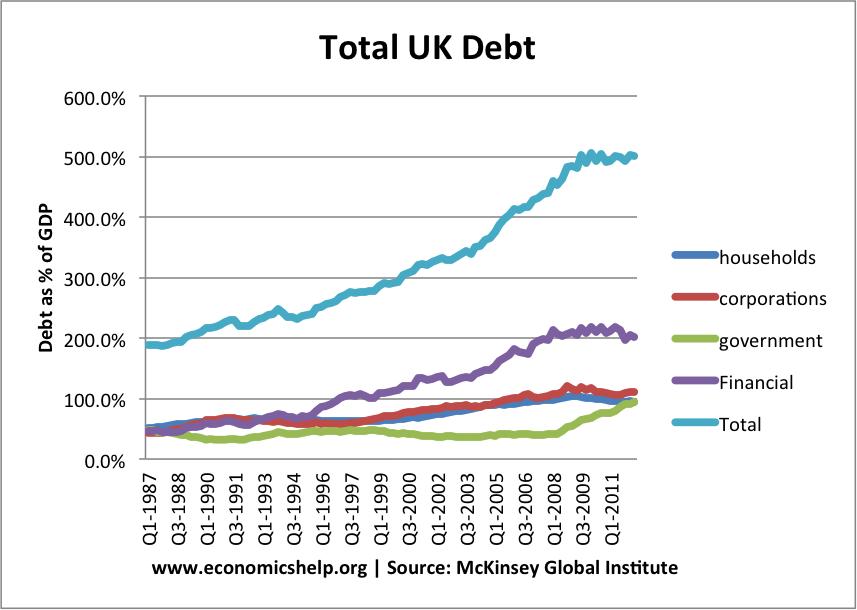
Financial debt is more complicated. The UK tends to have a large share of financial debt as a % of GDP because it has a large finance sector. But, these large liabilities are offset by high financial sector assets. Financial sector debt becomes a problem if assets fall in value. (e.g. during credit crunch)

During recession sharp rise in government borrowing – fall in household debt.
According to official data by Michael Saunders, Citigroup.
- Household debt has fallen from 111pc of GDP at the start of 2009 to 99pc at the end of 2012,
- For private firms excluding banks, debt has dropped from 121pc of GDP to 108pc.(Telegraph)
Though in future, household debt is projected to increase. Also rising interest rates will increase the debt burden
Other types of debt burden
The level of outstanding student debt is set to rise from £46bn to £200bn by 2042 (with an estimate that £70bn will never be repaid.) (Guardian)
External debt
Another type of debt burden to consider is the external debt – the amount UK citizens owe to people in other countries.
The UK has a high external debt (UK external debt is 406% of GDP, 2012) because of its large finance sector.
Does debt correspond to lower living standards?
Readers Comment: From National Debt: What appears tragic from this is that Britain’s cultural history can be read off from the 1900 – 2000 PSBR debt burden chart from the Bank of England above.
The chart’s peaks of PSBR above 100% of GDP mirror exactly the historical periods of social misery which George Orwell documented during the 1920s, 1930s and 1940s, with Britain characterised as a land of rootless tramps and unemployed all reliant on piecemeal charity, low paid jobs and money-lenders, a nation which even Orwell himself could not envisage having a universal welfare state. Our collective memories of this poverty finally begin to lift around 1965 and Beatlemania, a time exactly co-inciding with PSBR finally falling below 100% of GDP.
- Note: PSBR is the annual public sector borrowing requirement. This graph shows total public sector debt (often referred to as national debt).
It depends which way you look at it.
- Cause or effect. For example, the rise in borrowing in the 1930s was due to the Great Depression. In fact, efforts to keep government borrowing down in 1931 (cutting benefits and raising taxes) only made the recession much worse. It is fairer to say borrowing is an effect of economic malaise rather than a cause. At the same time, the long period of economic expansion made it easy to reduce government borrowing through the 1960s
You could also say: Look how much debt the UK had in 1945, yet, rather than focus on spending cuts, the government set up a very ambitious welfare state and universal health care.
Despite public sector debt reaching over 200% in 1950, this did not cripple the economy in the coming decades. The relatively huge level of debt proved no barrier to one of the longest periods of economic expansion on records.
People might say it was different in 1950
- It was easy to cut military spending which arose from the Second World War. (today Military spending is a very small % of overall government spending perhaps 3 or 4%)
- Private sector saving was higher in the 40s and 50s making it easier for the government to borrow.
- Demographic factors were more favourable in the 40s and 50s. There was a young growing workforce (boosted by immigration). Now we face an ageing population with increasing demands on health care and pensions.
Yet, whilst the above is true to a certain extent, if the banking sector recovers, the government should be able to recover a significant part of the financial sector intervention.
- Excluding financial sector intervention public sector debt is (46.6% per cent of GDP)
- With Financial sector intervention public sector debt is over £800bn or 56.8%.
So, even though public sector debt is definitely going to rise very rapidly, over the next few years. It is not necessarily the end of the world as some would like to make us fear.
Market fundamentals seems to have hit the top with valuations no more an intrinsic aspect, rather, speculation and higher returns on assets seems to be the pursuit for these investors. Ever since the March 9th rally, the global markets have seen unprecedented rally with some markets doubling in just 6 months or so. I remember one trigger, a report published in mid-February (16th precisely) early this year from Mumbai, India, by an economist who rightly predicted this scintillating Bull Run when the market was crashing down like cards. Moreover, the same analyst has been able to develop a statistical market model and an indicator system which might prove (and its proving either) doomsday for technical analyst or chartists around the globe. It runs something like p-value based trading system, which has some unique utilities. Using this, one can model interest rate trends, crude prices and other variables. However and whatever may it be, even if Roubini did correctly predict the recession, he was too pessimistic about the early recovery (see Bernanke’s comments on economic recover). And its’ time again we are into a major commodity bubble this time, with so much liquidity sloshing around, inflation is bound to happen, only by a matter of time, and by then, Fed would have had to act on its FFR, kept stagnant at 0.25% now. A very crucial incident that strangely and unexpectedly altered Asian Economy is that, Japan appeared to have recovered from her prolonged stagflation, marking the awakening of a sleepy-giant consumption driven economy. This single factor proves that the World economy no later, will however recover faster than that expected by Roubini and Co.
aks. jone
“(today Military spending is a very small % of overall government spending perhaps 3 or 4%)”
It’s actually closer to 5%.
Whilst 2% sounds like nothing, 5% is about £33bn, 3% is about £20bn.
Otherwise good article, thanks