Readers Question: How can we make sure children have equal opportunities? Equal opportunity means that all young people have a fair chance to succeed in life. Equal opportunities mean that wherever you are born in society, you would still have a good chance to reach any job, profession or position in society. It should mean …
Recently, the Euro has fallen from 1.5 Dollars to 1 Euro in 2011 to near parity in March 2015.
The fall in the value of the Euro has been very steep in the last six months.
This is a very significant depreciation in the Euro, and primarily reflects the greater economic weakness in the Eurozone. Related to the economic weakness, is the decision of the Eurozone to recently begin expansionary monetary policy (quantitative easing).
Why the Euro is falling
1. The ECB are embarking on Quantitative easing – the creation of money to purchase government bonds. Quantatitive easing tends to reduce the value of a currency because:
This increase in the money supply tends to reduce the value of the currency (greater supply tends to reduce price.)
Q.E raises expectations of higher inflation – higher inflation tends to reduce the value of a currency because it will become less attractive to buy EU goods.
Also purchasing government bonds will reduce bond yields in Europe, making it less attractive for private investors to save money in the Eurozone – you get a lower return on Eurozone assets. Investors would rather save in US assets, where interest rates are more likely to rise and you will get a better rate of return.
2. General weakness of the Eurozone economy. Some analysts believe that EU’s quantitative easing maybe a case of too little too late; they believe Q.E. in Europe may actually have a quite limited effect. This is due to two factors:
Readers Question: What is the name of a type of good that only has value to someone if no one else possesses it? A snob or ostentatious good is a good where the main attraction is related to its image of being expensive, exclusive and a symbol of social status. These goods will have restricted …
Readers Question on Debt and GDP Readers Question: OK so the debt to GDP looks manageable when it is compared to the figure during the world wars but : Q1. how do you calculate GDP rationally in wartime , did factories sell tanks to the army, were soldiers and workers paid commensurately for their labour ? GDP …
A look at why the Venezuela economy is dependent on oil, why it did not do more to diversify, and the problems of relying on a primary product like oil.
Readers Question: First, why are more than 90% of their exports based on oil? Under Hofstede’s “Uncertainty and Avoidance of Risk”, Venezuela is ranked as a country that goes to great lengths to avoid risk. But basing an entire economy on the prosperity of one commodity seems like the definition of risk. Your thoughts on that are much appreciated.
Firstly a few quick statistics on Venezuela economy. According to Wikipedia
Venezuela is an oil-dependent economy. Revenue from petroleum exports accounts for more than 50% of the country’s GDP and roughly 95% of total exports.
Manufacturing contributed 17% of GDP in 2006
Agriculture in Venezuela accounts for approximately 3% of GDP, 10% of the labour force.
Why does an economy base its prosperity around one commodity?
Firstly, Venezuela is not unique. Many countries specialise in oil and then later come to regret this specialisation. I have a Russian student who is asking exactly the same question – Why did Russia not take the opportunity to diversify away from gas and oil. (see: Russian economic crisis)
The problem is that when oil prices are high, it’s tempting to take advantage of the high revenues. Anything else seems much less profitable. Secondly, people may make the assumption oil prices will remain high – so they have plenty of time before needing to diversify the economy.
If you have vast reserves, then in the short term, oil production offers the quickest way to promote economic prosperity, higher tax revenues and higher government spending. By comparison, at the time, manufacturing and agriculture will offer much smaller returns and potential for exports.
In 2007, when oil prices were rising, the Venezuela economy was growing rapidly – 7% a year. With oil revenues, the government was able to begin ambitious spending programmes. Many in 2007/08 may have felt that high oil prices were likely to stay high. (I remember reading articles which predicted oil prices of $200 a barrel. Very few were predicting a collapse in prices to $40.
It is easy to say than do. If you have an economy that has a highly profitable oil industry, it is difficult to develop new manufacturing industries. This is for a few reasons.
The profitable oil industry will be attracting most investment and skilled labour.
Entrepreneurs will be reluctant to create new industries, where Venezuela doesn’t seem to have a comparative advantage; the prospect of profit is low and there is no guarantee they will be able to create new industries. Trying to work in the oil industry may seem more appealing and profitable.
The government, in theory, could try to diversify the economy. They could tax the oil industry and use the proceeds to subsidise the creation of new manufacturing industry. However, around the world, governments don’t have a great track record of ‘setting up new industries’ – The government is not expert in manufacturing and so it may struggle to decide which industries to create and where to spend money. There is no guarantee the government efforts to subsidise new industries will bear any fruit. Many governments would prefer to take the easier option of benefiting from the boom in the oil industry and hope the oil price stays high.
Governments are not noted for long-term vision and acting on the possibility of changing economic situations. The political process also encourages a short-termism. You don’t tend to win many elections by promising lower income now, and investment which may bear fruit 5-10 years in the future.
A look at the nature of the UK economic recovery. Is the recovery sustainable? Who has benefited the most from recovery? Which groups of people have not benefited from the recovery?
In the past two years, the UK economy has posted relatively impressive growth figures.
The UK posted annual growth of 2.6% between Q3 2014 and Q3 2013. ONS
It is impressive compared to Europe, which is stuck in recession. However, the recovery is less impressive when compared to the lost output since the start of the recession and the long delay that occurred before the economy started to catch up the lost ground.
The recovery has led to a significant decline in unemployment, whilst at the same time leading to low inflation (CPI = 0.5%).
From one perspective this looks very good – the main three macro-economic objectives (growth, unemployment, inflation) are posting good statistics.
However, the UK recovery is still unbalanced and there are uncertainties about its sustainability. The main areas of concern about the UK economic recovery are:
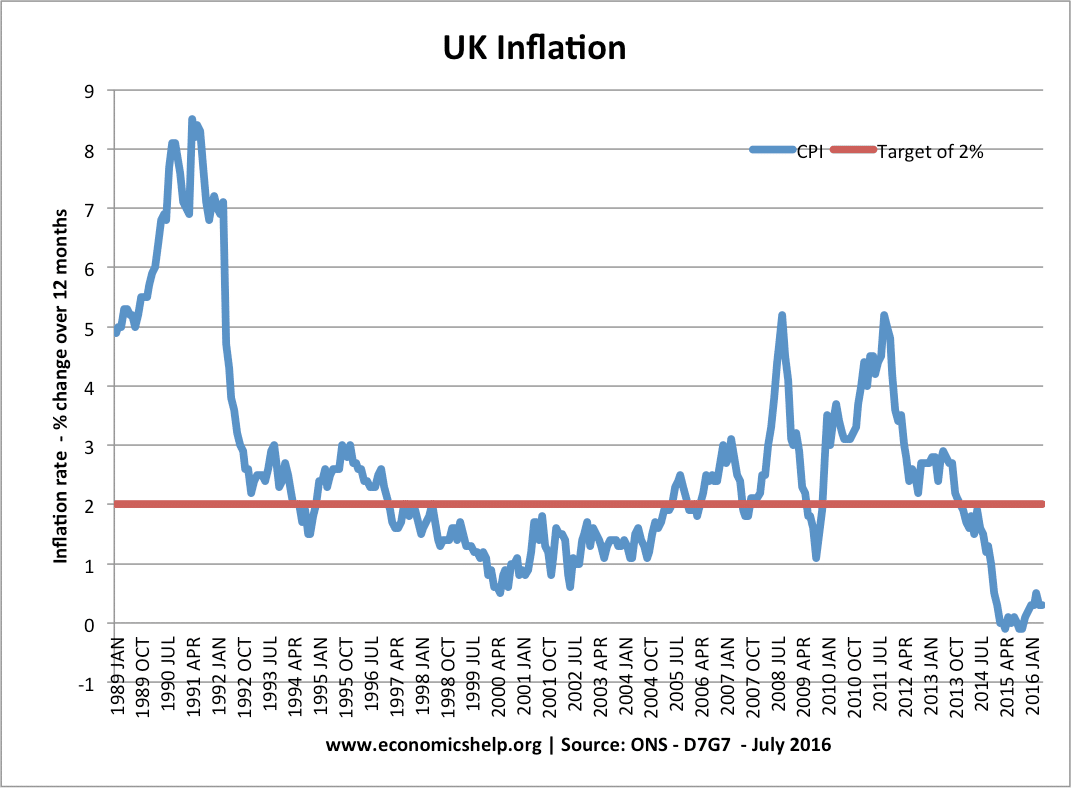
In the UK, there are quite a few different measures of inflation. All measures seek to show the annual change in living costs. However, different measures of inflation give different inflation figures. For example, RPI can often give a higher rate of inflation than CPI. CPI can also be misleading. For example, an increase in VAT would cause CPI to increase, but a core inflation measure like CPI-CT, would stay lower
It is important to be aware of different measures of inflation because the rate of inflation has an important bearing on monetary policy.
Usually, an inflation rate of CPI 4.5% would encourage the Bank of England to raise interest rates. But, if this inflation rate was due to cost-push factors, such as higher taxes, the inflation rate may not be due to overheating in the economy.
Inflation is calculated by:
Finding out the most commonly bought goods (e.g. Family expenditure survey)
Measuring the change in prices and then applying the weight of the good to the price change.
Different Measures of Inflation
1. Consumer Price Index (CPI) – official measure. Based on the EU HCIP (Harmonised Consumer index prices)
Includes taxes.
Excludes mortgage interest payments and housing costs
Includes some financial services not included in RPI
Readers question: explain benefits of increasing rate of unemployment benefit – for the unemployed , society and any cost that may result from such policy. Current Weekly Rates of Job Seekers Allowance in UK Contribution-based JSA Age JSA weekly amount 18 to 24 up to £57.90 25 or over up to £73.10 Contribution based …