
According to IMF figures, the countries with the highest share of government debt % of GDP are Japan (236%), Venezuela (164%) and Greece (150%)

Top 10 Share Debt Explained
1. Japan
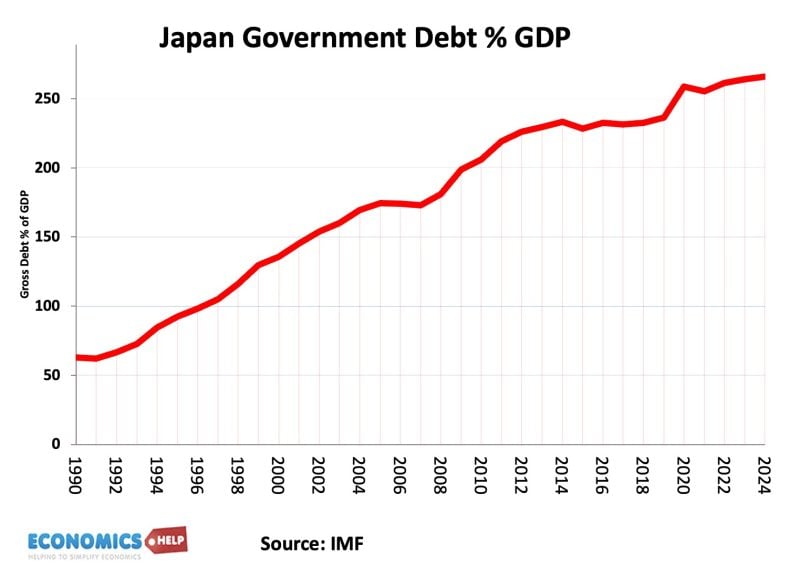
Japan’s debt exploded when the economies boom and asset bubble turned into deflation after the late 1980s. The economy slowed down and the government tried repeated fiscal stimulus (tax cuts and higher spending). Japan also has an ageing population, (which means high levels of savings). Japan was able to borrow so much for a long time because most of the debt was held within Japan. Both by domestic savers and by the Bank of Japan, who pursued QE (creating money to buy bonds). Therefore, the Japanese debt burden has not been too onerous (so far)
Japan also has high level of assets, invested in other countries
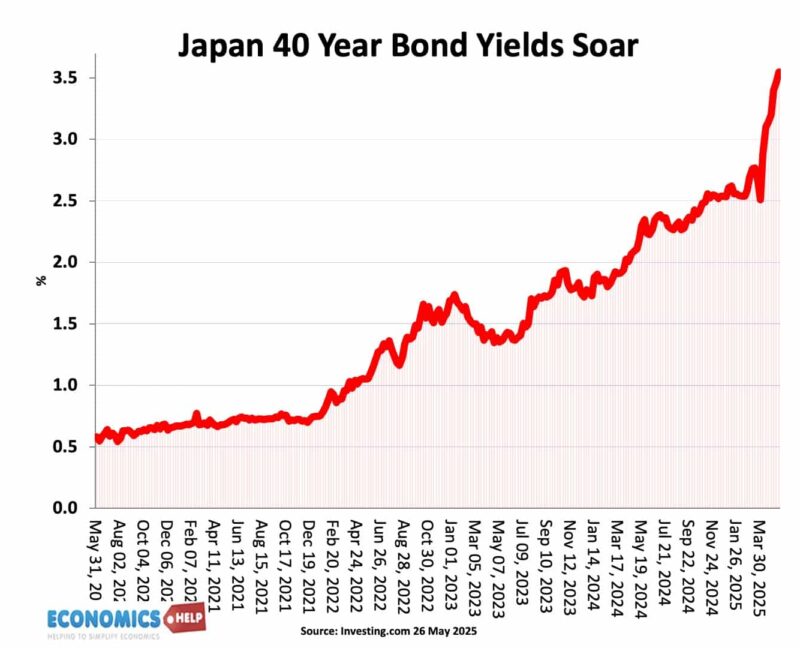
Though recently Japanese bond yields have risen. This is a problem because it is not so much how high debt is, but what is the cost of paying for debt interest payments. Rising bond yields will make Japanese debt more expensive.
2. Venezuela
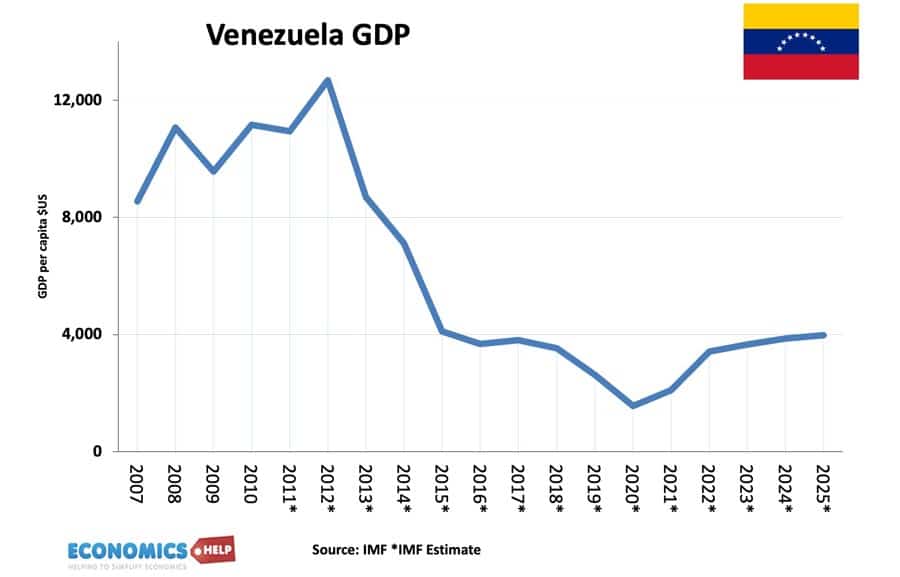
Venezuela debt rose for different reasons and is actually much more problematic than Japanese debt. Venezuela’s debt rose because the government relied heavily on oil revenues and borrowed heavily during the oil boom. When oil prices collapsed after 2014, they couldn’t cope with collapse in revenue. Mismanaged state control of the economy, price and currency controls, all caused oil production and tax revenues to fall. To try and maintain popularity the government kept high spending. But access to international borrowing dried up—worsened by sanctions. The government resorted to financing deficits by printing money, leading to hyperinflation and economic collapse; GDP shrank dramatically, pushing the debt-to-GDP ratio higher and resulting in default.
3. Greece
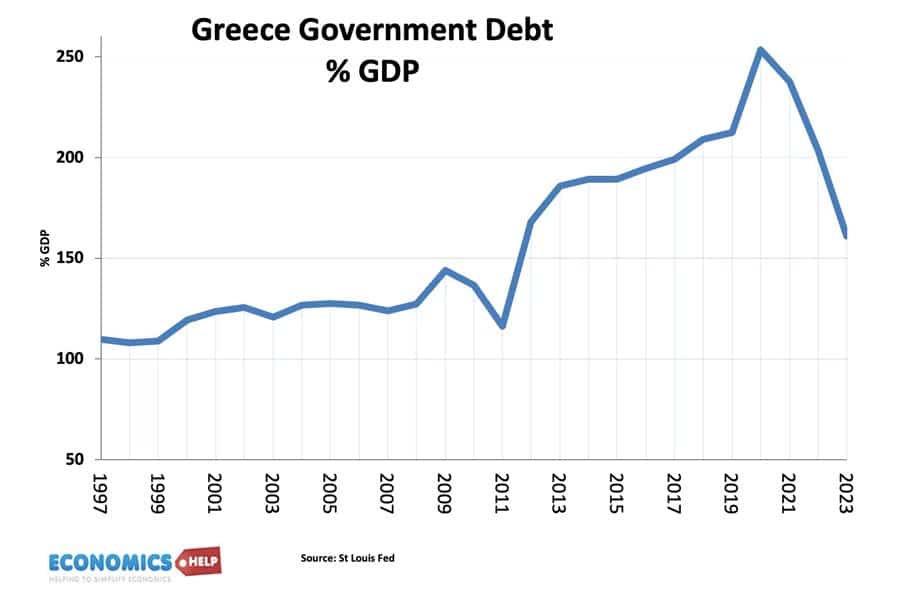
Greece had one of the worst economic crisis in the western world. In the EUro, they could borrow at low rates, running a huge current account deficit, but after financial crisis, they couldn’t repay loans, debt soared, and the economy was pushed into austerity which caused GDP to fall over 30%. Debt soared
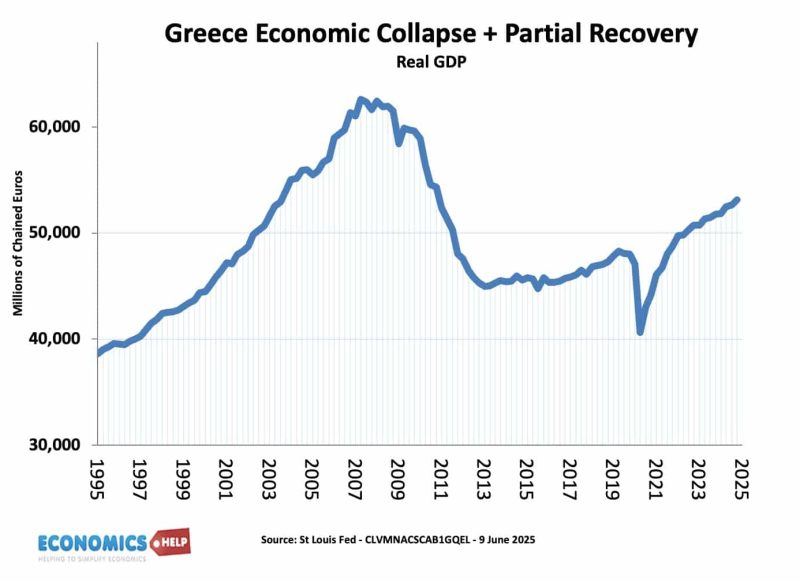
However, the story doesn’t end with collapse since 2016, the economy has started to recover and since 2020, the government have run a primary budget deficit which has seen the very high debt levels fall.
4. Italy
Italy has had exceptionally poor economic performance since 2000. It’s GDP growth has fallen behind comparable G7 countries. Combined with exceptionally low fertility rate and rapidly ageing population, this has predictably led to big rise in debt. Given Italy’s demographic forecast, this debt is a cause for concern
5. US
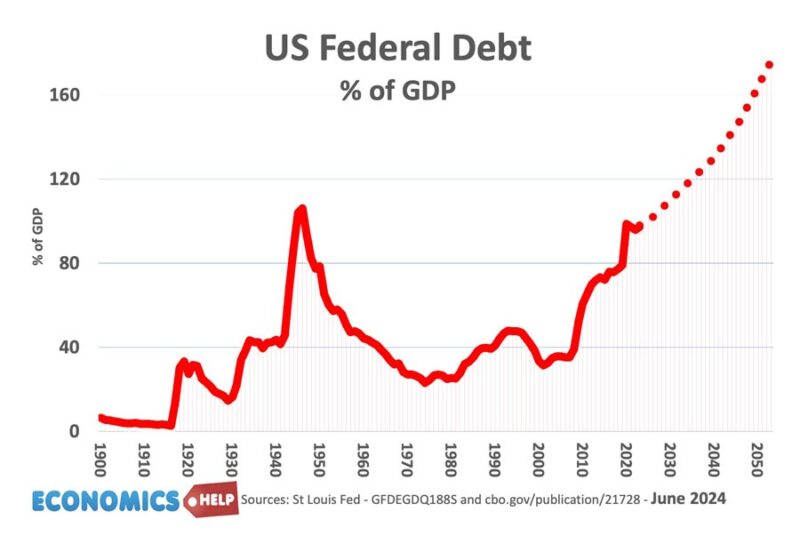
US is the biggest economy and the biggest bond market. But, the US also has (like many western economies) forecast of a rapid rise in debt, because of the ageing population
Is US heading for default – See US Debt is Increasing – Does it Matter?
Approximate 10-year government bond yields For Top 10
- Japan: ~1.8%
- Venezuela: Not available (in default / illiquid market)
- Greece: ~3.4%
- Italy: ~3.6%
- United States: ~4.1%
- France: ~3.2%
- Canada: ~3.2%
- Belgium: ~3.1%
- Spain: ~3.2%
- United Kingdom: ~4.5%
Top 10 cost of debt interest payments
The real cost of debt is not the actual level, but the share of revenue that goes to paying debt interest payments. This is determined by tax levels, bond yields and the impact of currency movements on foreign denominated debt.

This shows in 2023, Sri Lanka was spending an unsustainable 79% of all government revenue on debt interest payments. this led to an IMF bailout and a plan to reduce debt.
Full List of Countries debt share
| Debt % GDP | ||
| 1 | Japan | 236.7 |
| 2 | Venezuela | 164.3 |
| 3 | Greece | 150.9 |
| 4 | Italy | 135.3 |
| 5 | United States | 120.8 |
| 6 | France | 113.1 |
| 7 | Canada | 110.8 |
| 8 | Belgium | 104.5 |
| 9 | Spain | 101.8 |
| 10 | United Kingdom | 101.3 |
| 11 | Portugal | 94.9 |
| 14 | Egypt | 90.9 |
| 15 | Ukraine | 89.8 |
| 16 | China | 88.3 |
| 17 | El Salvador | 87.6 |
| 18 | Brazil | 87.3 |
| 19 | Finland | 82.5 |
| 20 | India | 81.3 |
| 21 | Austria | 81.2 |
| 22 | Hungary | 73.5 |
| 23 | Yemen | 70.9 |
| 24 | Malaysia | 70.4 |
| 25 | Israel | 67.8 |
| 26 | Slovenia | 67.0 |
| 27 | Cyprus | 65.3 |
| 28 | Germany | 63.9 |
| 29 | Montenegro | 62.6 |
| 30 | Colombia | 61.3 |
| 31 | Costa Rica | 60.2 |
| 32 | Iceland | 59.1 |
| 33 | Slovak Republic | 58.0 |
| 34 | Croatia | 57.6 |
| 35 | Thailand | 57.2 |
| 36 | Philippines | 57.1 |
| 37 | Panama | 56.6 |
| 38 | Albania | 55.7 |
| 39 | Poland | 55.3 |
| 40 | North Macedonia | 54.8 |
| 41 | Romania | 54.6 |
| 42 | Nigeria | 52.9 |
| 43 | Korea, Republic of | 52.5 |
| 45 | Australia | 49.8 |
| 46 | Tanzania | 48.2 |
| 47 | Malta | 47.4 |
| 48 | Latvia | 47.4 |
| 49 | Serbia | 44.5 |
| 50 | Belarus | 44.4 |
| 51 | Mongolia | 44.4 |
| 52 | Netherlands | 43.2 |
| 53 | Czech Republic | 43.0 |
| 54 | Norway | 42.7 |
| 55 | Chile | 42.0 |
| 56 | Honduras | 41.1 |
| 57 | Ireland | 41.1 |
| 58 | Indonesia | 40.2 |
| 59 | Nicaragua | 39.1 |
| 60 | Lithuania | 38.2 |
| 61 | Moldova | 38.1 |
| 62 | Georgia | 37.9 |
| 63 | Switzerland | 37.6 |
| 65 | Vietnam | 32.9 |
| 66 | Bosnia and Herzegovina | 32.8 |
| 67 | Uzbekistan | 32.6 |
| 68 | Sweden | 32.6 |
| 69 | Ethiopia | 32.3 |
| 70 | United Arab Emirates | 32.1 |
| 71 | Peru | 30.9 |
| 72 | Tajikistan | 29.5 |
| 73 | Denmark | 28.0 |
| 74 | Cambodia | 26.6 |
| 75 | Taiwan Province of China | 26.2 |
| 76 | Luxembourg | 26.0 |
| 77 | Türkiye | 26.0 |
| 78 | Kazakhstan | 24.8 |
| 79 | Bulgaria | 24.1 |
| 80 | Estonia | 23.6 |
| 81 | Russian Federation | 20.3 |
| 82 | Congo, | 19.3 |
| 83 | Nauru | 17.6 |
| 84 | Kosovo | 16.9 |
| 87 | Kiribati | 9.9 |
| 88 | Turkmenistan | 4.6 |
a
Source: IMF
About The Author
