The recent history of the Pound to Euro, and forecasts for the next few months.
Latest Sterling exchange rates at Bank of England
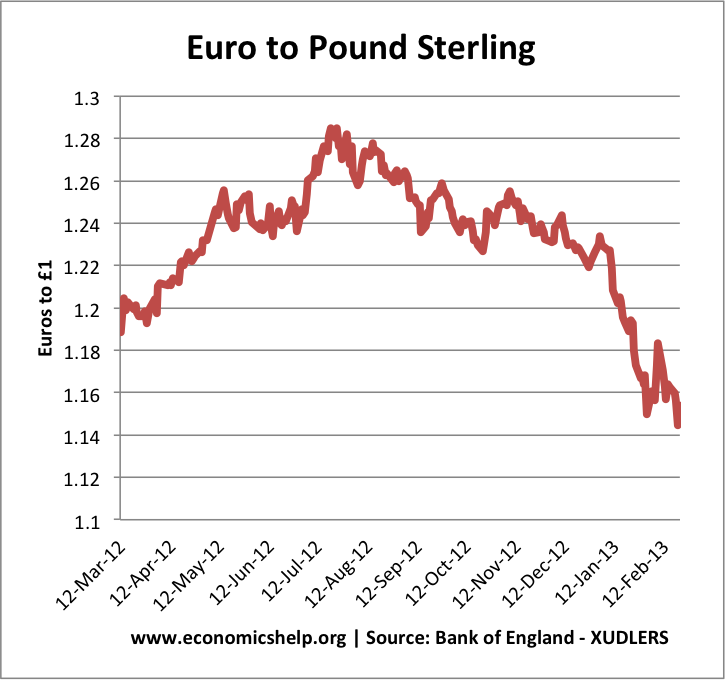
Since the summer of 2012, the Pound has fallen nearly 11% against the Euro. The main reason is that the intervention of the ECB has helped to stabilise the Euro and EU debt fears have temporarily receded. As a consequence, money has started to flow into the Eurozone again, and there is less reason to see the UK as a safe haven compared to the Euro.
Secondly, the UK economy has been stagnating. In 2012, we entered a double dip recession, and there is a chance of a triple dip recession in 2013; the UK might avoid a technical recession, but the overall outlook is grim (see: economic growth). Because the UK is experiencing a very slow recovery, it makes it difficult for the government to reduce its debt to GDP ratio.
In Feb 2013, Moody reduced the UK debt rating to AA1 for the first time in history. Moody’s downgrade occurred because they were concerned at the stagnant growth in the UK, which meant tax revenues will be less than expected making it difficult to reduce the debt to GDP ratio. The downgrade was largely expected and won’t have a direct impact on exchange rate, but it is a reflection of the disappointing economic performance.
UK Current account deficit
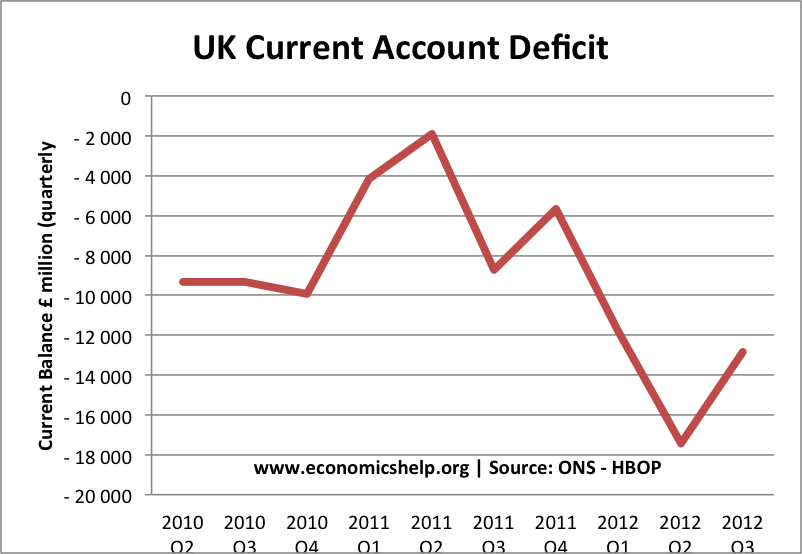
Some fear that given the significant current account deficit (UK deficit is around 3% of GDP), the Pound may continue to fall against the Euro. Some commentators feel that the pound will need to fall to £1 =€1 to restore competitiveness and rebalance the economy.
The logic of this negative outlook for Sterling against the Euro, is that there is now nothing about the UK economy which deserves to give it a ‘safe haven status’ compared to the Euro. With the ECB now more willing to intervene against liquidity shortages, the UK has no real value as a safe haven alternative, which is seemed to at the start of 2012. Furthermore, with a credit rating downgrade and poor prospects for growth, the UK economy is likely to struggle, keeping interest rates low and making it less attractive as a place to attract investment.
Weak growth and quantitative easing
The weak prospects for economic growth raise the prospect of extended quantitative easing in the UK. Further monetary easing will contribute to inflationary pressures and weaken Sterling. In recent years, the UK has been more susceptible to cost-push inflation than the Eurozone, the extent of quantitative easing in the UK means that this relatively higher inflation in the UK may continue. Ironically, depreciation of the past few months itself will cause some cost-push inflation, like in 2009.
However, bear in mind underlying weaknesses in the Eurozone
Before, we write off the Pound, bear in mind, that the Eurozone still faces significant structural problems, which have only been temporarily averted by ECB intervention since last year. There is no guarantee that there will remain satisfactory ECB intervention. Also the bond purchases haven’t resolved the more deep-seated problems of low growth and very high unemployment within the EU economy. Markets may worry about the inflationary impact of quantitative easing in the UK, but arguably this is a stronger long-term position than being locked into deflation debt spirals that many southern Eurozone economies are facing. The Eurozone bond crisis has been temporarily been put on the back burner, but it is far from solved.Long-term Eurozone economic problems may return to haunt the Euro.
Euro to £ since 2005
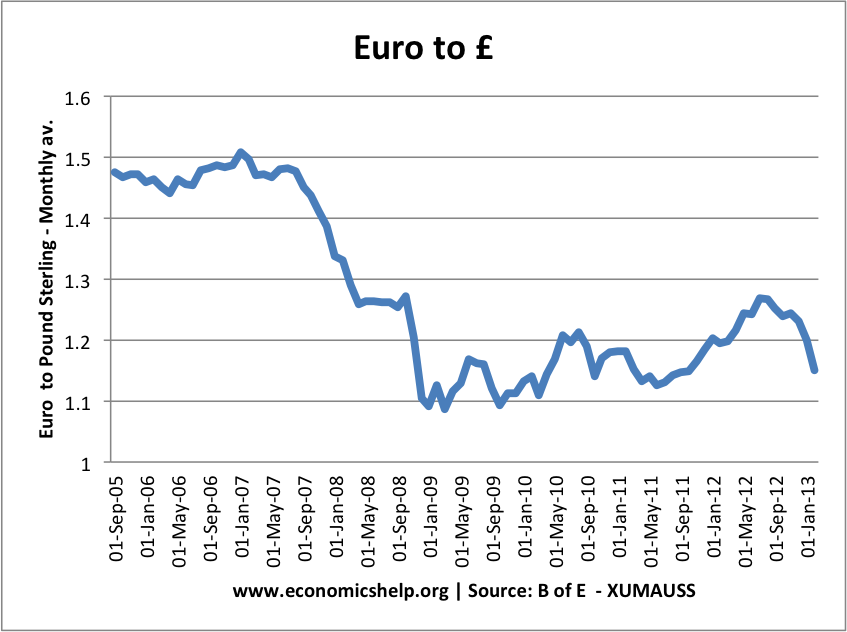
The appreciation from 2009 to Aug 2012 has been wiped away by recent depreciation
Outlook for Pound to Euro in 2013
The Pound may continue to fall closer to 1.0 as we rebalance the UK economy, but any resurgence of problems in the Euro, could lead to a reversal of the Pound’s fortunes.
These are the economic factors which will influence the future value of the Pound.
Read more