Are we heading for another Credit Crunch?

interest-rate-yield-06-23

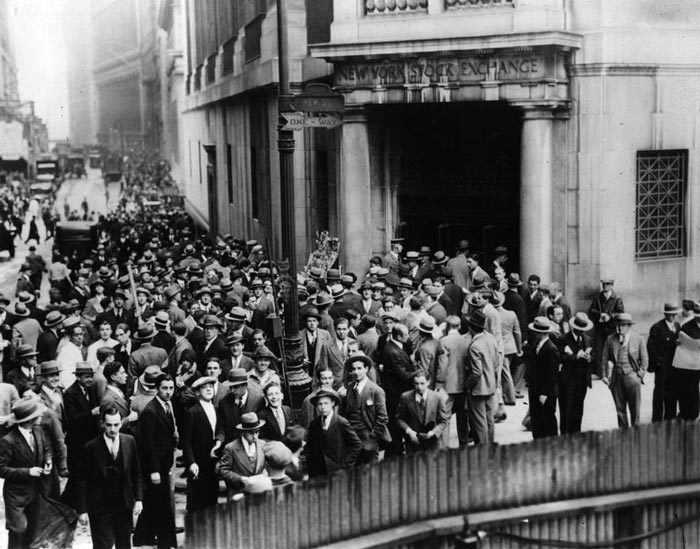
In 2008, the world global banking system went into meltdown after the bankruptcy of Lehman Brothers. It stemmed from a toxic combination of falling house prices, rising interest rates and sub-prime mortgage debt. To relive the 2008 Credit Crunch – see this article on Credit Crunch Explained (which was one of my earlier articles as …

Read more

Problems of UK Housing Market

cost-renting

The UK housing market is something of a national obsession. But, it faces numerous problems High prices (especially affecting younger people) High cost of renting – Shortage of properties Decline in birth rates due to high living costs Concealed households – people having to live with parents Inequality Volatility of prices Homelessness Since the early …

Read more

10 Brexit Costs on the Economy

uks-lost-output-gdp

Brexit Costs include Food inflation/Food shortages Devaluation of Pound Slower economic growth Fall in tax revenue/less spending Custom Duties and Tax Decline in Trade Fall in Business Investment Labour Shortages Illegal crossing/Small crossings Frictions to travel   10 Problems of Brexit: Why The Economic COSTS Keep GrowingWatch this video on YouTube   In recent weeks, …

Read more

House Prices Forecast to drop in 2023

uk-monthly-house-prices-mar-23

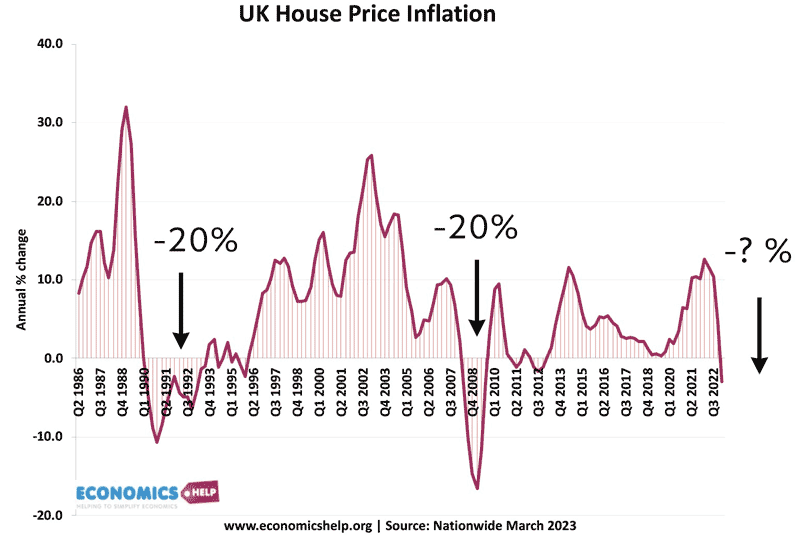
Last week, the Nationwide reported a sixth consecutive monthly fall in house prices. They are now 6% down on last summer’s peak with buyers able to get an average £14,000 off the asking price. Annual price changes are falling at the fastest rate since 2012. Yet, some analysts wonder if the worst is already over? …

Read more

Bond Yields Explained

us-bond-yields
  • UK bond yields are the rate of interest received by those holding Government bonds.
  • Governments sell bonds (also called gilts) via the Debt Management Office to fund their budget deficits. Bonds are a way for the government to borrow – a bit like the government taking out a loan.
  • Government bonds are frequently traded on bond markets. Therefore, their market price may be quite different to the original price set by the government.

Example of why bond yield changes

A government may sell a 10-year, £1,000 bond at 5% interest. This means every year the government will pay £50 to the holder of this bond.

  • If demand for government bonds rose, this £1,000 bond would increase in price as investors pushed up the market price.
  • But, the government still pay £50 a year interest until maturity. If the market price of the bond rises to say £2,000, the interest rate (yield) is now 2.5% (50/2,000)
  • Therefore higher demand for bonds leads to lower bond yields.
  • Conversely, if people sell bonds, this pushes up the bond yield (e.g. what happened in UK September 2022)

How a change in price of a bond changes the effective yield

bond-yield-price

The law of the bond market

inverse-relationship-bond-yield-vs-bond-price

  • As bond value rises, interest yield falls
  • As bond value falls, interest yield rises

Video summary

The Bond Market Explained - Why the Bond Market can force government's to do U-Turns

Recent UK Bond Yields

10-year-gilts-85-22-web

Source: Bank of England – 10-year bond yields

Read more

Phillips Curve Explained

phillips-curve2

Summary of Phillips Curve

The Phillips curve suggests there is an inverse relationship between inflation and unemployment.

phillips-curve2

This suggests policymakers have a choice between prioritising inflation or unemployment. During the 1950s and 1960s, Phillips curve analysis suggested there was a trade-off, and policymakers could use demand management (fiscal and monetary policy) to try and influence the rate of economic growth and inflation. For example, if unemployment was high and inflation low, policymakers could stimulate aggregate demand. This would help to reduce unemployment, but cause a higher rate of inflation.

In the 1970s, there seemed to be a breakdown in the Phillips curve as we experienced stagflation (higher unemployment and higher inflation). The Phillips Curve was criticised by monetarist economists who argued there was no trade-off between unemployment and inflation in the long run.

However, some feel that the Phillips Curve has still some relevance and policymakers still need to consider the potential trade-off between unemployment and inflation.

Origins of the Phillips Curve

The Phillips curve originated out of analysis comparing money wage growth with unemployment. The findings of A.W. Phillips in The Relationship between Unemployment and the Rate of Change of Money Wages in the United Kingdom 1861–1957 suggested there was an inverse correlation between the rate of change in money wages and unemployment. For example, a rise in unemployment was associated with declining wage growth and vice versa.

Original Phillips Curve Diagram

300px-philipsus60

This analysis was later extended to look at the relationship between inflation and unemployment. Again the 1950s and 1960s showed there was evidence of this inverse trade-off between unemployment and inflation.

Read more

Item added to cart.
0 items - £0.00