OBR Predict fall in House prices in 2023
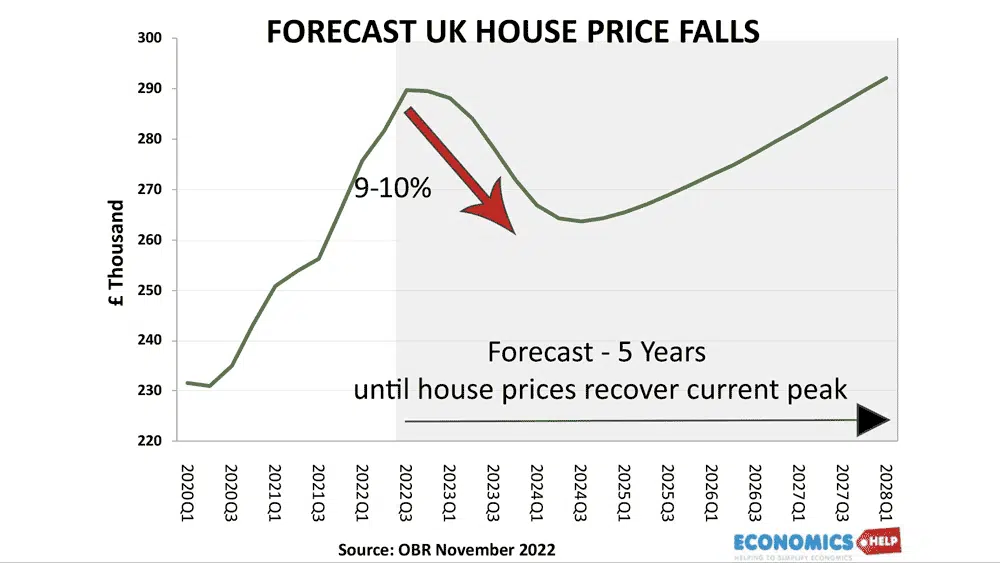
Last Thursday the OBR published a detailed forecast for the UK economy. It made for grim reading – the longest recession for a generation, falling disposable income and real wage growth around 35% less than its pre-crisis trend rate. Why Experts Predict 10% FALL in House PricesWatch this video on YouTube Amongst the dire economic …