A selection of graphs and statistics on UK unemployment. Also, looking at factors that explain changes in UK unemployment. Why unemployment was lower in the 2000s and 2010s than 1980s and 90s. A success story of the UK economy?

Raw data: Labour market data | Source: ONS MGSX (LFS)
Current UK Unemployment rate
- An unemployment rate of 4.8%, (1 Sept 2021) – (UK Unemployment at ONS)
- The UK employment rate was estimated at 76.2%
- 1,281,000 million unemployed people. (ONS)
Employment rates
- The UK employment rate was estimated at 76.2% (proportion of people aged 16-64 in work) – ONS
- Employment: 32.801 million people in work.
Participation rate
- Inactivity rate (the proportion of people aged from 16 to 64 who were economically inactive) – 20.8% (ONS)
- See also: Participation rates
Claimant Count
- 3.5% Dec 2019 – Claimant Count is the number of people receiving the job seekers allowance. This was considerably less than the official ILO measure of unemployment but recently has caught up with the ILO/Labour Force Survey (LFS).
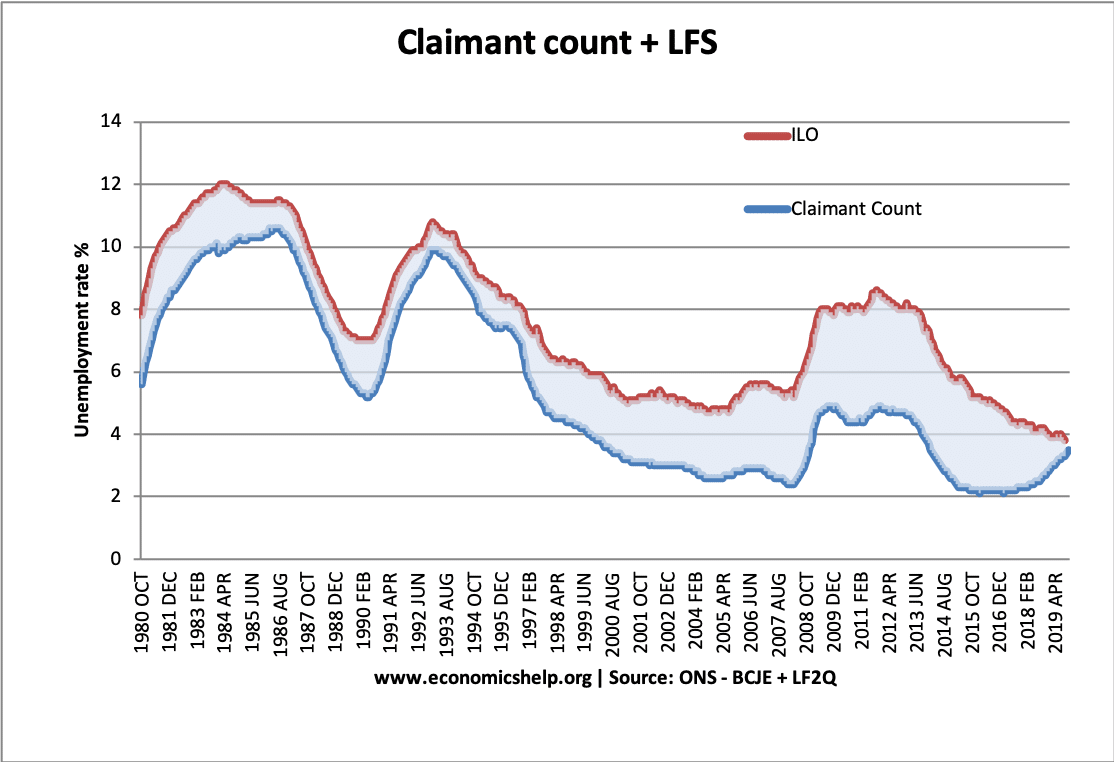
- The claimant count is the number receiving unemployment benefits.
- The labour force survey involves asking people if they are currently out of a job and actively seeking work. Some people unemployed may not be eligible for job seekers allowance.
Explaining changes in unemployment since 1980
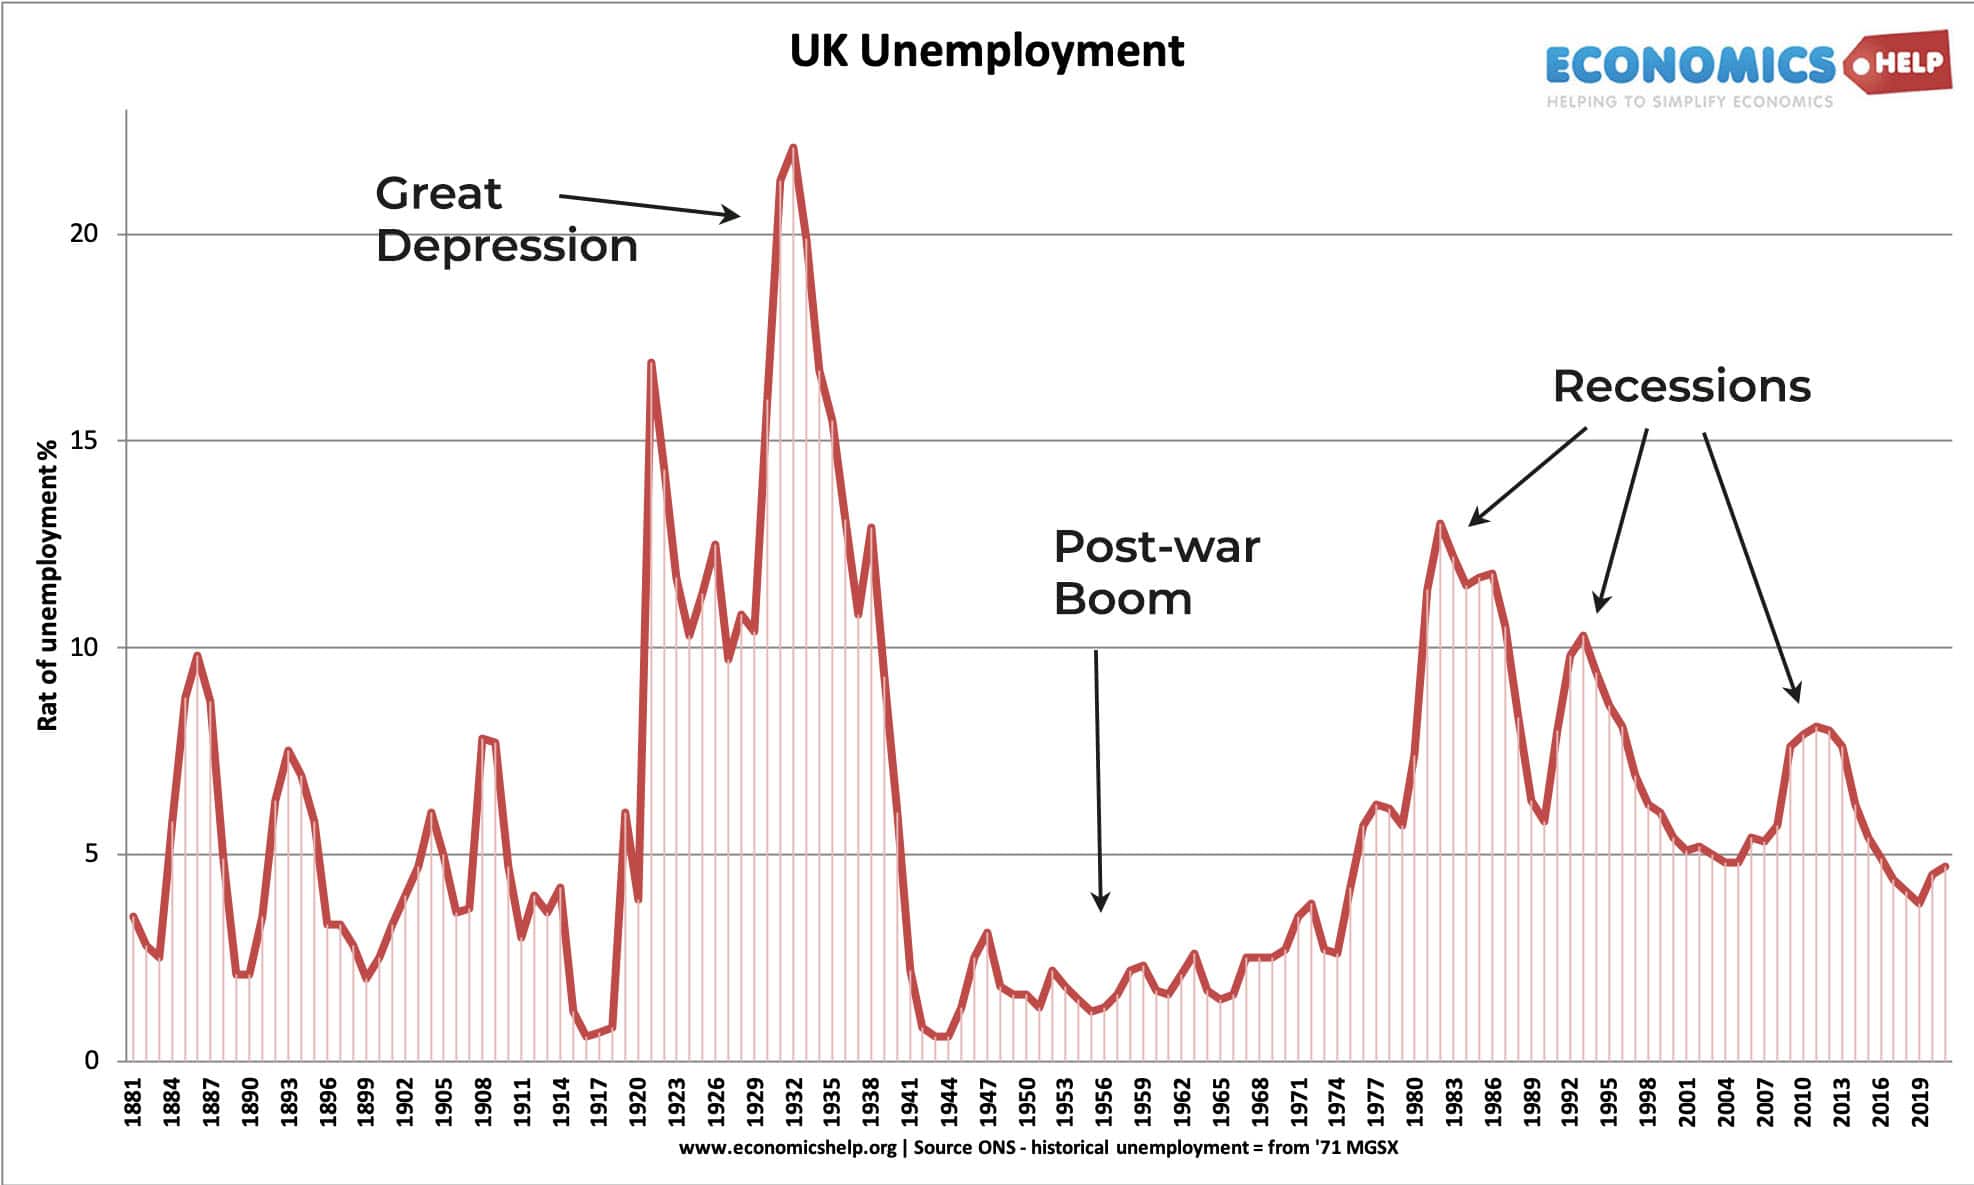
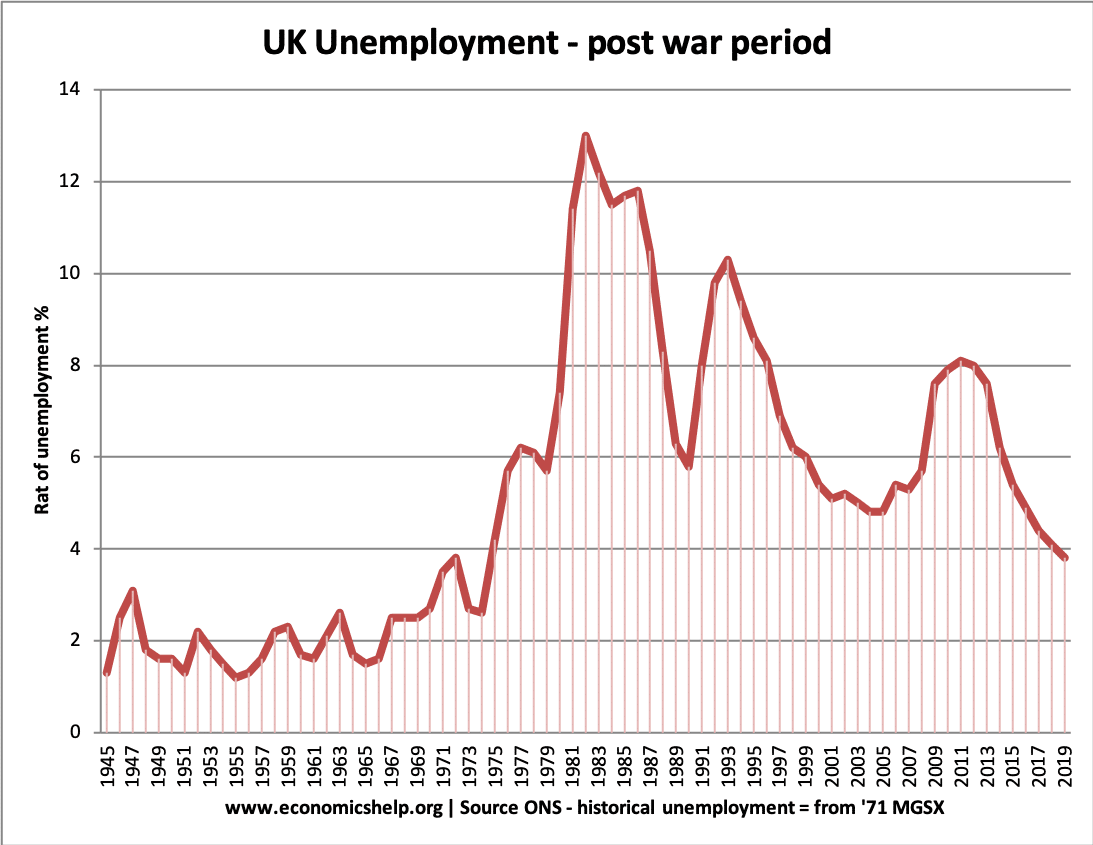
Unemployment rose to a post-war peak in 1982 (12%) due to the recession of 1981. The unemployment was concentrated in former industrial areas, which suffered from falling output during the early 1980s. Unemployment did not fall below 3 million until the mid-1980s, when the economy started to boom. Another recession in 1991, caused another rise in unemployment to over 3 million (10%).
During the long boom of the late 1990s and 2000s, unemployment fell to a low of 5%. This was near full-employment. In 2008, the deep recession caused a sharp rise in unemployment due to people being laid off in the recession.
Why has unemployment fallen during the prolonged recession of 2008-14?
The great recession of 2008-13 includes one of the most sustained falls in GDP. (See: Great recession 2008-13) Yet, despite the extent of the fall in GDP, unemployment peaked at 8.5% and since 2011 has fallen. This fall in unemployment has surprised some economists because the economy has remained weak, with economic growth stagnant. In a less severe recession, unemployment rose by more. The lower unemployment in this recession is due to several factors:
- Falling real wages. Nominal wages have struggled to keep up with inflation.
- Greater labour market flexibility encouraging firms to keep on workers, through flexible working practices such as zero hour contracts
- A fall in labour productivity, meaning that firms have been willing to keep on workers, despite falling output.
- Benefit changes making it harder to get job seekers allowance and encouraging more people to seek jobs.
- A rise in disguised unemployment / under-employment – shorter working hours.
- Some economists suggest that GDP stats have underestimated the strength of the recovery. Recent GDP stats have shown strong economic growth
- See also: The UK unemployment mystery – why unemployment is lower than might be expected.
General causes of UK unemployment
- Recession – causing cyclical, demand deficient unemployment. With falling real GDP, firms are producing less and therefore, there is less demand for workers. Also in a recession, some firms go out of business causing people to lose their jobs.
- Structural factors. There is structural unemployment due to the fast-changing nature of the economy. For example, manufacturing jobs have been lost due to the economy becoming more service sector based. Some unemployed workers have found it difficult to get jobs in new high tech industries because they lack the relevant skills.
- Geographical unemployment. Unemployment is higher in certain regions and particular areas (e.g. north). There are geographical immobilities making it difficult for the unemployed to move to the south, where more jobs are available.
- Frictional unemployment. There is always some unemployment due to frictional factors, e.g. it takes time for the unemployed to find a new job.
- Youth Unemployment is highest amongst young workers – often because they lack skills or the right motivation.
- see also: Causes of unemployment
Youth Unemployment in the UK

Youth unemployment 1992-2012 See more on youth unemployment
Trade-off between unemployment and inflation

The Phillips Curve suggests there is a trade-off between unemployment and inflation. The theory is that higher economic growth helps reduce unemployment, but inflation is likely to increase. By contrast, a reduction in demand would cause job losses and unemployment to increase but reduce inflationary pressure. However, in the real world, many other variables can lead to a breakdown in this trade-off between the two.
International Unemployment rates

Eurozone traditionally higher unemployment. During Covid US unemployment rose rapidly as EU and UK kept workers on furlow.
Under-employment
- In 2014, just under 1 in 10, or 3.0 million people, employed in the UK wanted to work more hours than they are currently employed to do and are therefore classified as underemployed. (ONS) | more on under-employment
Historic Unemployment – since 1880
Related
- Policies to reduce unemployment
- What is the true level of unemployment? To what extent is there hidden/disguised unemployment
- Unemployment at ONS
Thanks for your info It helps me a lot.
– What four “hurdles” must a worker overcome in order to receive unemployment benefits, at least in theory?
– Do you think that the $600 per week EXTRA in UI benefits is overly generous? Why or why not? Should the $600 per week in EXTRA unemployment benefits be reinstated for the tens of millions of people who had a job in Jan. 2020 but do not have a job now? Why or why not?