Tax on sugary soft drinks

A few years ago, I looked at the arguments for and against a tax on ‘fatty foods‘. Generally, I supported the idea of a tax on unhealthy foods because it is a way to price the full social cost of the good. It is an example of a Pigovian tax. A tax which internalises the external cost of the good.  Recently, the Academy of Medical Royal Colleges has produced a report stating 10 factors that could help reduce the UK’s obesity epidemic. One of these is an experimental 20% tax on sugary soft drinks.

A new study claims a 20 per cent tax on sugary drinks would reduce the number of obese adults in the UK by 180,000, bring in £276m to the Treasury and save the NHS millions.

The logic behind the new tax.

  • Higher price will reduce demand and make ‘healthier alternatives’ more attractive.
  • Over time, the higher price may change peoples spending and eating habits.
  • The sugary soft drinks create an external cost – of contributing towards obesity. Since obesity has external costs, the tax is making people pay the full social cost. It is the same principle as taxing petrol so people pay the social cost of congestion and pollution.
  • You could also argue sugary soft drinks and other unhealthy foods are a demerit good. People don’t know (or ignore) the damage to health. Making them more expensive discourages the consumption of these demerit goods.
  • If the tax is on volume, it may encourage people to enjoy smaller sizes.  Then people can enjoy without drinking to excess. e.g. the free refill is a popular marketing tool, but encourages consumption to excess. But, could a tax stop free refills?
  • It could raise up to £0.3 billion. This £0.3 billion could be used to lower other taxes, such as VAT or it could be used to increase spending on the NHS or specific obesity units.


Read more

US debt and deficit stats

A selection of graphs and statistics about US Federal debt and the US Federal budget deficit / surplus.

US Federal Deficit since 1946

The federal deficit is the annual difference between federal spending and federal tax revenues. For example, in 2012,

  • Federal receipts (tax e.t.c) were $2,450.2 billion ($2.4 trillion) (15.8% of GDP)
  • Federal spending was $3,537.1 billion (22.8% of GDP),
  • leaving a federal deficit of  $1,087.0 billion ($1.1 trillion) (7.0% of GDP)

budget-deficit-46-13

Source: Whitehouse.gov

 US borrowing during World War Two

Budget deficit % of GDP
1942-14.2
1943-30.3
1944-22.7
1945-21.5
1946-7.2
19471.7

During the Second World War, the deficit reached over 30% of GDP in 1943!

US Federal deficit since 1995

budget-deficit-95-13

The US budget deficit has fallen in 2013 more than initial forecasts. The government says the deficit for the 2013 budget year totaled $680.3 billion, down from $1.09 trillion in 2012. (a fall of 37%. see: Washington Post) The fall in the deficit is due to spending cuts (-2.4%) which took place in March and due to rising tax revenues (+ 13%) from higher economic growth.

The Whitehouse estimate for 2013 was originally 6% of GDP, but the CBO have updated that to a deficit of just 4% of GDP.

 Commentary

The US faced a political battle about raising the debt ceiling. But, recent budget data offers encouraging signs of a reduction in government borrowing. Importantly, the biggest reduction in the federal deficit came from a surge in tax revenues due to economic growth. The biggest challenge facing the US economy is to maintain a strong economic recovery. This will be the best way to continue improve short-term and long-term debt projections.

Given the rate of deficit reduction, there was no economic logic to raise the threat of massive spending cuts, which would only have risked plunging the economy back into recession.

Read more

US economy stats

A short summary of main US economy stats and where to find more detailed stats. Other data GDP: $16.66 trillion (Q-2 2013) GDP per capita $49,601 (2012) 10th, nominal; 6th, PPP Gini coefficient 0.48 (2011) Labor force 155.6 million (11.26 mil. unemployed) Related pages at economicshelp.org History of US national debt Other helpful external links …

Read more

Britain’s recovery – strong or weak?

There are different ways of looking at the UK recovery. Firstly, we can look at the damage done to the economy since the peak in 2008. The black lines suggests a possible pre-crisis trend rate of economic growth. A rough rule of thumb, suggests that had economic growth been maintained at the pre-crisis trend rate …

Read more

Growth of the global tablet market

Back in the summer of 2010, Apple launched the iPad. It was launched to great excitement and it seems the initial euphoria was well placed. From sales of zero at the start of 2010, the tablet market has expanded to over 100 million units a year as we come towards the end of 2013. Sales forecast predict global tablet sales will reach 200 million a year by 2016.

It is an astonishing growth and is changing the way people access information on the internet.

The decline of the traditional computer?

The rapid growth of tablets is bad news for sales of laptop computers and desktops. Laptop sales fell 8.6% in the Q3 2013, and sales of laptops have now fallen for six consecutive quarters; sales have fallen to levels last seen in 2008.

I often ask my students if they use tablets or computers, it is increasingly common for people to say they hardly turn on their computer, but just use tablet or mobile phone. On a personal note, I bought one of the first Ipads but I never really got on with a tablet (I sold it on ebay a few weeks later). Perhaps I am missing something? Though a mac-book air, is closer to a tablet than most laptops.

Apple Market Share of Tablets

Apple is  the leading brand. Despite being the most expensive tablet, it still retains 45% of the market share. However, it has a serious competitor in the Android OS which is fairly close to Apple market share (though split amongst different manufacturers). Apple also has the advantage of being the most profitable, able to charge a higher price than many other tables. Apple benefits from:

  • Being the first mover in the market.
  • Apple compatibility with iPhone and other Apple products
  • Strong brand loyalty
  • Technological advances making it one of the best products.

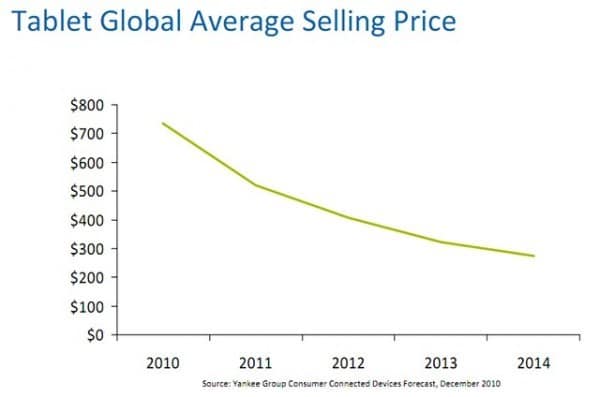
Why is the price of tablets falling?

tablet-price-1
Source: mobile mag

Since the introduction of the Apple iPad back in 2010 at a price of over $700, the average price of a tablet has been falling quite significantly, and market forecasts suggest it will keep falling. Note, this fall in price has occurred despite the rising demand. Several factors explain this fall in the price of tablets.

  • Price skimming. When Apple launched the product at $700, there was an element of price skimming. Charging a high price to attract those customers willing to high price for a tablet. Since then, many new firms have been seeking to attract a new range of customers more sensitive to price. The price of an iPad could also be described as ‘premium pricing‘ – charging a high price to reinforce the impression Apple is the best quality. Recent tablet models are less keen to claim they are the best quality.

    Read more

Can government help industry?

To what extent can the government help boost domestic industry and manufacturing?

In recent weeks, several politicians have talked about their desire to help UK manufacturing and boost industrial production. It may be a noble endeavour to try and boost UK industry and rebalance the economy away from financial services to manufacturing. But, how practical is it for the government to actually boost manufacturing output?

industrial-production-1970-2012
Can a government halt the long-term decline of UK industry?

The main ways governments might be able to help industry could include:

  1. Stable macro economic environment – low inflation, sustained positive economic growth
  2. Satisfactory availability of credit – A working banking sector willing to lend to firms
  3. Investment in infrastructure – better transport links to reduce firms costs
  4. Improved labour productivity – through better education and training of workers
  5. Increased geographical mobility – easy for firms and workers to move
  6. Removal of unnecessary red tape and regulations
  7. Environment which promotes research & development
  8. Subsidy to help develop certain technologies.
  9. Stable exchange rate – avoiding over-valuation of the exchange rate.
  10. Low tax rates.

    Read more

Facebook and productivity

How much is the internet helping to increase productivity? Do distractions like Facebook and Twitter mean the overall benefits of the internet are less than we might hope? How does the internet compare to other technology revolutions, such as stem power and electricity?

coffee

I often work from a cafe. It’s a nice combination – good Italian coffee, a bit of caffeine and writing becomes quite enjoyable. At a cafe, there are less distractions that at home – no telephone to answer, no door-to-door canvases to politely turnaway. The growth of the internet and the laptop has enabled more people to work away from  home and really work anywhere. Working from the comfort of a cafe is one of the brave new world of flexible working practises. When I go to a cafe, I always see quite a few other people of this new generation of laptop workers.

I’m not a nosy person, I wouldn’t want to look at what other people were working on. But, sometimes, you can’t help but glance at a screen. The funny thing is that when ever I see a screen, it nearly always seems to be Facebook! I have no idea what people do on Facebook (I don’t have an account). But, my theory is that if you take a random look at a laptop, 50% of the time people will be logged on to Facebook. So are all these laptop workers really increasing their productivity by working from home?

This ‘survey’ is hardly scientific. But, it’s ironic that a new technology like the internet has given so many opportunities to increase productivity, but at the same time given so many opportunities to decrease productivity.

When Henry Ford made use of the assembly line, he enabled a huge growth in productivity through exploiting economies of scale, but there was no real downside. True working on an assembly line can become boring and there is a danger of reducing worker morale, but the assembly line doesn’t give an infinite supply of distractions like funny cat photos or instant messaging from people you went to school with 20 years ago. The assembly line is pretty much a one way conveyor belt to increased productivity. The internet, by comparison is a different kettle of fish.

Through using the internet, you can find information much quicker than the old method of going to a library and handing in a request to the librarian. It has enabled more data to be made available that previously was unavailable.

But, the problem with having all your information at your finger tips, is that there are innumerable distractions. Bored with researching UK inflation? well there are plenty of more entertaining things to pass your time. Before you know it, hours can pass and the original intention of working has been lost in a sea of innumerable videos, links and comments.

In the good old days, you would go to work in a library. If you got bored you could stare out of the window or perhaps make a paper airplane to throw out of the window, but now when you go to work, you can be inundated with numerous distractions and temptations.

How much is the internet actually increasing productivity?

In the past few years, we continue to make huge technological strides. The price of laptop computers continues to fall, whilst their power increases. Yet over the past few years, labour productivity statistics in countries like the UK and US have been mostly disappointing.  

Read more

Item added to cart.
0 items - £0.00