In the past few years, Central Banks have been buying bonds to
Increase money supply
Reduce bond yields
The aim of quantitative easing is to avoid deflationary pressure and increase economic growth. Ending quantitative easing will mean The Central Bank stop buying any more bonds. The process will then be reversed and, in time, the Central Bank will start selling the government bonds that they have.
The implications of this will be:
Falling bond prices and rising bond yields. Q.E. has had the effect of making bonds more attractive. Demand has been boosted by the Central Bank intervention, and this has encouraged investors to buy bonds (also helped by the relative security of bonds during a recession) However, when the Central Bank sell bonds, the price will go down, and this has the effect of increasing bond yields.
It is not just the Central Bank who will sell bonds. The fear is that when the markets see the Central Bank is ending Q.E. they will sell bonds because they know the market is turning. This is shown by the fact that bond yields rose following just an announcement from Federal Reserve that Q.E. may end ‘at some time in the future’
Money supply. If banks buy bonds from the Central Bank, they will see a fall in their cash reserves, and in theory, this could lead to lower bank lending as they maintain liquidity reserves.
However, this effect may be very limited because quantitative easing in the first place didn’t really encourage any increase in bank lending. Banks just sat on their increased reserves. Arguably we have had the wrong ‘type’ of quantitative easing – but that is another question.
When interest rates were cut to 0.5% in March 2009, few would have expected them to remain at 0.5 until the present time. Yet, we have seen an unprecedented period of zero interest rates. There is much speculation about:
When interest rates will rise?
How much will interest rates to increase to?
What will be the effect of rising interest rates on an economy, that has got used to low interest rates?
When will interest rates rise?
Essentially interest rates will rise when there are signs of a strong economic recovery, which is starting to cause the threat of demand pull inflation. The problem is that, over the past few years, the UK has seen many ‘green shoots’ of recovery which have failed to translate into a lasting recovery. In recent months, retail sales have improved – indicating some signs of recovery, but the EU recession is holding back recovery, creating a patchy picture. Policy makers will want to see annualised growth of 2.5% a year before there is greater confidence that the UK is leaving the this era of stagnant growth.
Important factors in signalling an end of zero interest rates
Signs of core-inflation. The main motivation for raising interest rates is to prevent a return of inflationary pressures. If core inflation (which strips out volatile factors) starts to increase above 2%, then there will be a strong case to increase interest rates. In Europe and US, inflation is actually falling to below 1.5%. The UK headline inflation rate is higher, but during the great recession, the Bank of England have correctly been suspicious of the CPI rate. It hasn’t a true reflection of demand pull inflation – more a reflection of cost-push factors.
Wage inflation. A key sign for a return to economic normalcy, will be an increase in real wages. Currently nominal wage growth is very weak. Many workers are seeing wage freezes. In this climate of real wage cuts, economic activity is depressed and the case for higher interest rates remains very weak.
Fall in unemployment. The US and UK have seen moderate falls in unemployment levels, but unemployment is still significantly above the natural rate (structural unemployment). Whilst there remains demand deficient unemployment, there is a case for keeping monetary policy loose (low rates). Also, there is a well-grounded fear that unemployment rates offer a slightly better picture than reality. Unemployment figures have been masked by a rise in under-employment.
Any sign of boom in the housing market. An increase in house prices could restart a round of higher spending, driven by the ‘wealth effect’ However, in the UK, house prices still look overvalued on ratios of house price to incomes. A fall in house prices may be more likely than rising house prices.
How much will interest rates increase?
This is an interesting question. Pre-crisis, ‘normal interest rates’ may have considered to have been 5% There is a widespread assumption that a return to trend rate growth of 2.5% and inflation of 2%, would see interest rates of 5% – giving us a more normal real interest rate.
However, as Mervyn King recently pointed out, many young homeowners have borrowed extensively to get on the property ladder.
Expensive house prices
A small increase in interest rates will significantly increase the cost of mortgage payments, and therefore a small increase in interest rates will have a large impact on reducing economic growth. (see more housing stats) Because we have got used to low interest rates a small increase will have a big impact on the economy. In other words, the UK is particularly sensitive to interest rates. If interest rates increased to 5% quickly, it would have a large contractionary effect – which would end the nascent recovery. Therefore any increase in interest rates to prevent inflation can be relatively small.
Containerisation is a system of standardised transport, that uses a common size of steel container to transport goods. These containers can easily be transferred between different modes of transport – container ships to lorries and trains. This makes the transport and trade of goods cheaper and more efficient. The container was invented in 1956 by …
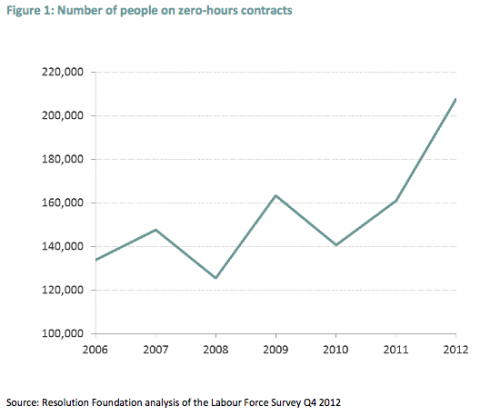
One feature of the labour market in the past 10 years has been the rise of zero-hour contracts. This is a contract where the employer is not obliged to employ a worker for any number of fixed hours. It means that the contract is highly flexible in terms of hours worked. This is obviously advantageous for an employer who has fluctuating demand and who seeks to cut the wage bill in quiet periods.
Flexible working hours can have benefits for some types of workers, e.g. students or second income earners who like the flexibility of doing different amounts of hours from week to week. Some also credit flexible working practises for limiting the rise in UK unemployment during the recent recession.
However, for many workers, zero hour contracts have greatly increased the uncertainty of work. It means, in quiet periods, many workers can be left with insufficient income to meet monthly bills. This increased labour market flexibility, thus comes at a cost of increased uncertainty and lower-income.
Securitisation involves changing loans into tradeable bonds.
Securitisation can increase the liquidity of banks and enable banks to engage in more lending than previously.
Securitisation was a factor in the credit crunch because it enabled banks to lend more than usual. When there was a shortage of credit in the banking system, banks became over-exposed and faced a shortage of cash (liquidity)
The difference between loans and bonds.
Loans are viewed as assets on a banks balance sheet. Loans cannot generally be sold on or traded. Bonds can be traded and sold to other financial institutions.
What is involved in the process of securitisation?
Any asset with a predictable income stream can be securitised, e.g. mortgage loans have a predicted income stream from the mortgage repayments over the term of the mortgage.
A financial institution (often called Special Purpose Vehicle SPV) sells bonds to investors and uses the proceeds of these bond sales to buy the loans off the bank.
The bank gains cash from the sale of its loan assets.
Investors gain a bond and the promise of income from the bonds. (e.g. bondholders will effectively gain income from the mortgage repayments)
The intermediary makes money from selling bonds at a higher price than the cost of buying the loan bundles
Customers who took out loans from the bank won’t notice any difference. They still make their loan repayments to the bank. It is just that now, the bank doesn’t have the loans on its balance sheet. And as soon as the bank receives loan repayment, it passes it onto the SPV.
Why do banks want to pursue securitisation?
Banks have to keep a certain percentage of deposits in cash (liquid). This is to ensure the banks can repay savers who wish to withdraw their deposits at any moment from the bank. (If a bank couldn’t meet depositors demands for cash, it could cause a run on the banks and a loss of confidence.
Keeping a certain percentage of deposits in cash reduces profitability of a bank. Because a bank can’t lend this money gaining fees and a higher interest rate on the loan. Instead, they have to keep cash which earns nothing.
However, if a bank securitises its loans into bonds, the loans are no longer on its balance sheet (it could be described as off-balance sheet finance)
The bank has exchanged loans for cash. With this cash, it can now lend more, making more profitability.
The problem with securitisation
Securitisation enables banks to effectively lend a higher percentage of their deposits. This was fine when market conditions were good. However, there were two major problems.
In the US, customers began defaulting on mortgage repayments. Therefore, banks didn’t have income to pass onto SPVs and onto bondholders.
Previously secure mortgage bonds became worthless and so investors lost money. This led to a shortage of liquidity. No one wanted to lend. But, banks which had lent more than usual now faced real capital shortages. They couldn’t raise money by selling bonds to meet deposit requirements. This was a significant factor in the credit crunch.
Note: the primary cause of credit crunch was the large scale defaults on sub-prime mortgages. But, the process of securitisation meant that many banks and financial institutions lost money indirectly, and banks were much more exposed to these failed mortgage repayments.
Essentially, it involves committing to a more flexible fiscal policy which can take into account the different requirements of liquidity trap (ZLB). Monetary policy should also be more flexible having a dual mandate of nominal GDP and inflation.
A summary of possible policy changes.
Flexible Fiscal Policy
Long term goal of reducing debt to GDP to a suitable level (e.g. 40%)
The long term goal should not inhibit expansionary fiscal policy if the economy needs it. If there is evidence of deep recession (i.e. zero lower bound rate – nominal rates at 0.5%) then fiscal policy should be used to stimulate economic growth.
Deficit targets should be flexible to take account of cyclical downturns, i.e avoid mistakes of premature of fiscal consolidation when economy is too weak to absorb austerity.
Flexible monetary policy
A dual policy mandate should target low inflation, but also economic growth. This would give the Central Bank more flexibility to ignore cost-push inflation and also consider the wider economic environment.
Higher inflation target to give Central Bank more flexibility in achieving economic growth. The UK experience between (2008-13) has shown that inflation can be stubbornly above 2% – even if there is substantial spare capacity and unemployment. A higher inflation target makes sure we avoid deflationary pressures.
In a previous post, we saw how bank lending in the UK fell during the credit crunch, contributing to the length and depth of the recession. Because of this the Bank of England and Government have sought to try and increase bank lending – in order to help stimulate economic growth. Fall in bank lending. …
Economic defeatism is a situation where policy makers accept an economic situation which is well below potential. Another form of defeatism is to see some problems as intractable and concentrate on dealing with side issues.
Economic defeatism is contagious because it can set the tone for the whole economy, making it even more difficult to resolve the situation.
Example of economic defeatism
The response to the great depression. Liquidate the banks!
As Andrew Mellon famously advised Herbert Hoover at the onset of the great depression.
“liquidate labor, liquidate stocks, liquidate farmers, liquidate real estate… it will purge the rottenness out of the system. High costs of living and high living will come down. People will work harder, live a more moral life. Values will be adjusted, and enterprising people will pick up from less competent people.” Hoover, Herbert (1952). Memoirs. Hollis and Carter. p. 30.
This isn’t so much economic defeatism, but revelling in depression. Yet, it is most striking reminder of how embrace of liquidation can create economic misery.
Europe 2008-13
Throughout the great recession, the EU have shown little ability, willingness or enthusiasm for decisive action to deal with growing unemployment and the prolonged recession. Instead, policy makers have focused on the necessity of sticking to fiscal targets, arguing there is no option but to deal with growing government debt. The consequence is that the EU have made little efforts to deal with the recession, and are at risk of experiencing a lost decade. Instead, there have been vague talks of supply side reforms and hopes that fiscal austerity will provide a stronger framework for future recovery. (see also: confidence fairy)
An alternative view. The alternative view would be to see the EU unemployment rate as unnaturally high and see the figure as something that can and should be reduced. Loose monetary policy, the willingness of ECB to buy bonds and less damaging fiscal policy could all reduce unemployment and create more signs of growth. With this focus on growth and full employment, European economies would be in much stronger position to deal with the ”less important’ macroeconomic objective of government borrowing.