What Would Happen if the Euro Collapses?

Readers Question: What would happen if the Euro collapses? The most likely scenario is that countries will leave one by one. A country would default on its debt and decide best option is to leave and create a new currency. The first country to leave would be Greece. Greece would be damaging, but if Greece …

Read more

EU Government Spending as % of GDP

Readers Question: when I read the EU spends 50% of their GDP, what does that actually mean? That half of Europe’s taxes are spent on government projects like welfare and entitlements, like taking money from the left hand pocket and putting money in the right hand pocket? I’m lost. Could you please use credit cards or something else as an example to help me understand the principles involved in these two problems?

This is a list of government spending as a % of GDP

Some EU Examples

France52.8
Sweden52.5
Denmark51.8
United Kingdom47.3
Greece46.8
Portugal46.1
The Netherlands45.9
Germany43.7
Poland43.3


China20.8
Gabon20.1
El Salvador20

You can see there is a big variance. Countries in the EU tend to have a higher rate of government spending, e.g. France 53% of GDP, UK 47%. US is 38%.

To simplify this. We could assume the average citizen for a country. Let us assume the average citizen receives 20,000 Euros. In France, the citizen would pay to the government 10,000 Euros (assume 50% tax rate).

That same ‘average citizen’ would receive 10,000 Euros of government spending. Free health care, free education, pensions, the benefits of military defense.

In the US, the ‘average citizen who earns $20,000 would pay $7,600 in taxes to the government. In return the US would receive $7,600 in government spending (education, military defense, roads e.t.c).

I put the ‘average citizen’ in brackets to simplify. Of course, people pay different tax rates. Some receive more government spending than others. But, it helps to understand.

What do Governments Spend Their Money on?

government spending

Read more

What Debt Levels are Dangerous?

Readers Question: Could you please help me understand why high debt as a big percentage of GDP is bad, or at what point does it becomes bad? Japan is at something like 194%, and the UK at 500% (counting all debts and liabilities). Both countries are still waking up every day and going about business (I guess). What do those comparisons of debt to GDP actually tell me?

Firstly, the statistic for UK at 500% looks like UK external debt. Or more likely it could refer to the total UK debt i.e. Private + Public debt. See: UK Total Debt.

194% looks like Japan’s government debt, though Japan government debt is now over 220% of GDP. Total Japanese debt is similar to the UK.

The government often need to know and decide at which level public sector debt is a  problem.

For example, at the moment, Public sector debt in different countries is:

  • Japan 225% of GDP
  • UK 64% of GDP (2012) (excluding financial sector intervention
  • Portugal 83% (2010 est. of GDP)
  • Spain 63% (2010 est.)
  • see: list of debt by Country

national-debt-1910-2019

Also, if you look at historical national debt, the UK has had much higher debt levels. In the early 1950s, UK debt was over 200% of GDP. Does that mean the UK could triple its current government debt? Well, probably not. Circumstances are different in 2012 to the early 1950s.

From these statistics, you might expect Japan to be in the greatest difficulty because it has by far the highest levels of debt.

Yet, markets are not really concerned about Japan public sector debt levels. Bond yields on Japanese government debt are very low. See: Why can Japan borrow so much?

However, markets are very worried about government debt levels in Portugal and Spain. Bond yields on Portuguese and Spanish debt have risen significantly in the past few months. Bond yields on Portuguese debt at the end of 2011 was 13%

Read more

Should the Unemployed Work for Benefits?

If someone is claiming unemployment benefits should the government be able to make them work a full-time jobs to remain eligible for benefits? You could argue that if someone is receiving unemployment benefits, offering them ‘job experience’ may have certain benefits. Benefits of Unemployed having to Work It makes sure people are not claiming benefits …

Read more

Debt Forgiveness for Developing Countries

Debt forgiveness is a programme to cancel or reduce the amount of debt a person, or usually country, has.

Debt forgiveness is an emotive issue because many feel it is wrong that low income developing countries suffer from high debt burdens when they really need the money to invest in improving economic welfare. Many developing countries spend a high % of GDP on servicing the debt burdens.

For example, it has been estimated that for some sub-Saharan African Countries the interest on their debt burden is over 200% of their total export value.

Therefore, in the West, there has been much pressure for the government to write off Third World Debt.

In 2005 Live 8, raised the issue again, with Governments taking some steps to cancel Third World Debt. However, critics argue this debt was cancelled by merely using existing Aid money. Therefore, in practice little was done to improve the Third World Development

Read more

What Determines the Effects of a Recession?

In this post, I looked at the long-term effects of a recession. It examined the various short-term and long-term costs of recession (fall in output) The impacts of a recession can vary depending on the type of recession and also the extent of the existing welfare state. Extent of Welfare state. The impact of a …

Read more

Primary Budget Deficits of EU

A primary budget deficit refers to the amount by which government spending exceeds government tax revenues. It does not include the additional cost of debt interest payments on the government bonds. This is why you sometimes hear different statistics. For example, the primary budget deficit of Greece is about 9% of GDP, but with debt …

Read more

UK Economy 2012

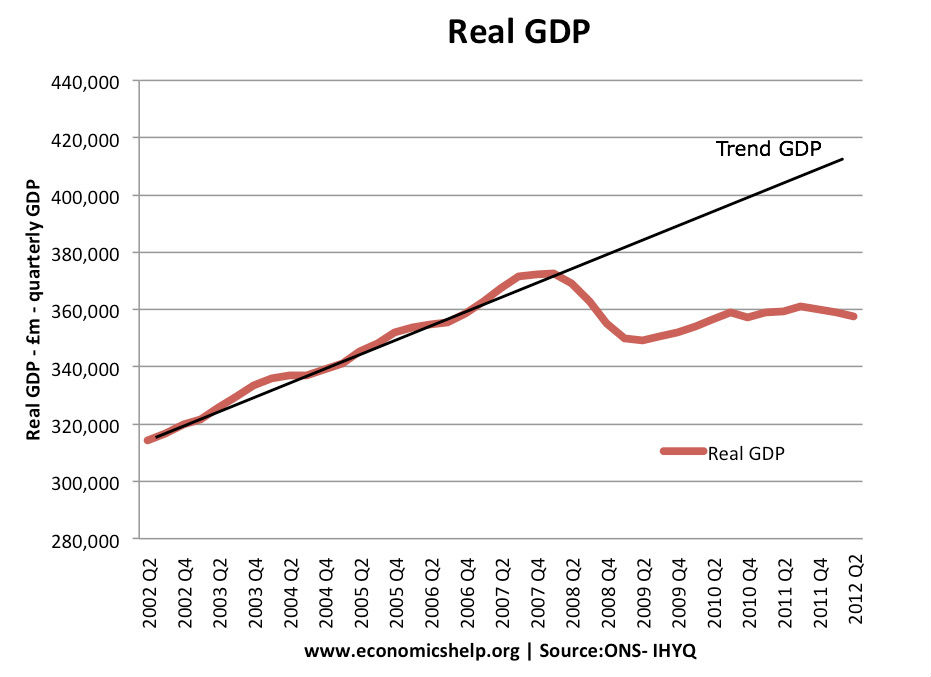
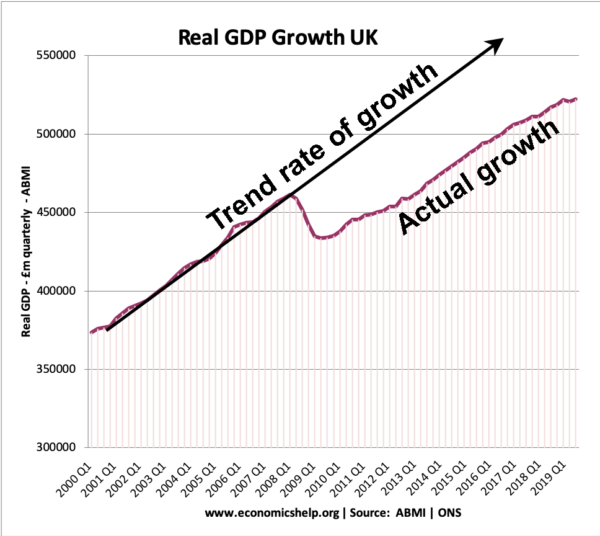
Since 2007, the UK has experienced a variety of economic shocks which have caused a prolonged period of economic stagnation, high unemployment and uncertainty. In 2011, the economic recovery proved much weaker than expected, yet inflation was stubbornly high. In 2012, fundamental weaknesses are likely to keep the UK economy depressed with high unemployment and low / negative growth. The one small crumb of comfort is the expected fall in headline inflation.


UK Snapshot

ukeconomy

UK Inflation 2012

ukeconomy

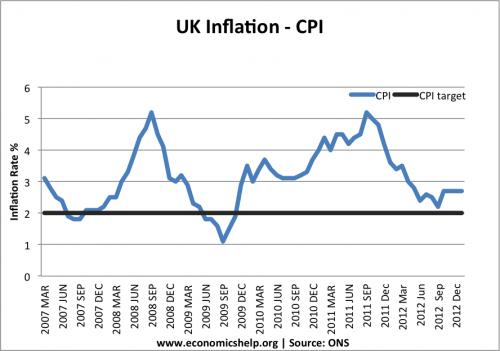
In 2011, CPI inflation reached 5.2%. RPI reached over 6%. (CPI RPI Inflation) However, the Bank of England forecast a sharp fall in inflation during 2012. This is because in 2011, inflation was caused by temporary cost-push factors, which will expire during the course of 2012. These cost-push factors include:

  • One-off tax rises, such as VAT
  • Effect of devaluation and higher import prices
  • Rising commodity and food prices

In 2012, underlying inflationary pressures will be weak. Spending cuts, high unemployment and weak wage growth will prevent any demand-pull inflation. A global economic slowdown will weaken pressure on commodity prices. There is risk by end of 2012, inflation could fall below government’s target of 2%

Inflation Forecast 2012/2013

inflation forecasts 2012

The Bank of England forecast a sharp fall in inflation in 2012. (Bank of England inflation forecast)

Interest Rate Forecast 2012

With this inflation forecast, and prospect of double dip recession it is highly unlikely the Bank of England will be wanting to increase interest rates during 2012. (Interest rate forecast)

Unemployment

ukeconomy

2011 was a grim year for unemployment in UK and EU. The ILO measure of unemployment rose to over 2.6 million. Youth unemployment rose to over 1 million, with an increase in the average duration of unemployment. With weak / negative growth predicted for 2012, unemployment is likely to continue to slowly rise.

Read more

Item added to cart.
0 items - £0.00