


Government debt under Labour was a major factor in the elections of 2010 and 2015. But to what extent did the Labour government really plunge the economy into debt during 1997-2007?
Usually, when people say ‘it’s debt that got us into this mess’. They tend to view all types of debt as the same – equating government debt to financial debt incurred from selling sub-prime mortgages in the US. However, this is deeply misleading. The consequence of bad debt defaults in the financial system is very different to government debt financed through selling bonds.
Government debt
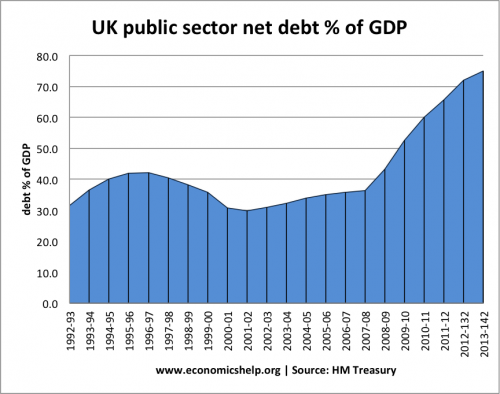
In 1997, public sector debt as % of GDP:
- 1997/98 – 40.4% of GDP
- 2007/08 – 36.4% of GDP
- 2010/11 – 60.0% of GDP.
- May 2019 – 82.9% of GDP
At the start of the great recession in 2007, public sector debt had fallen from 40.4% of GDP to 36.4% of GDP. This was despite increased real government spending. After the start of the crisis, public sector debt almost doubled in the space of three years.
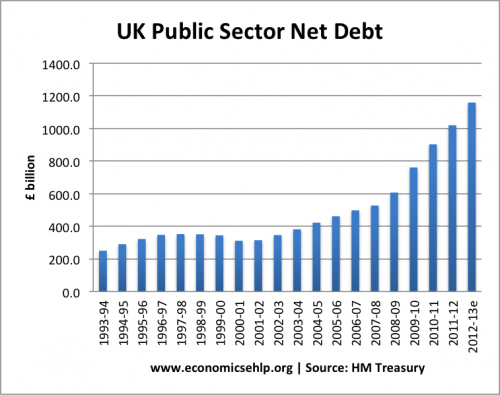
If we look at just actual government debt, there is a significant increase.
In 1997, the total public sector debt was:
- 1997/98 – £352 bn
- 2007/08 – £527 bn
- 2010/11 – £902 bn
Debt to GDP statistics were helped by the period of strong economic growth – a reminder that economic growth is as important at debt levels. It is also worth bearing in mind UK public sector debt in comparison to the post-war period.

