An examination of UK house price affordability.
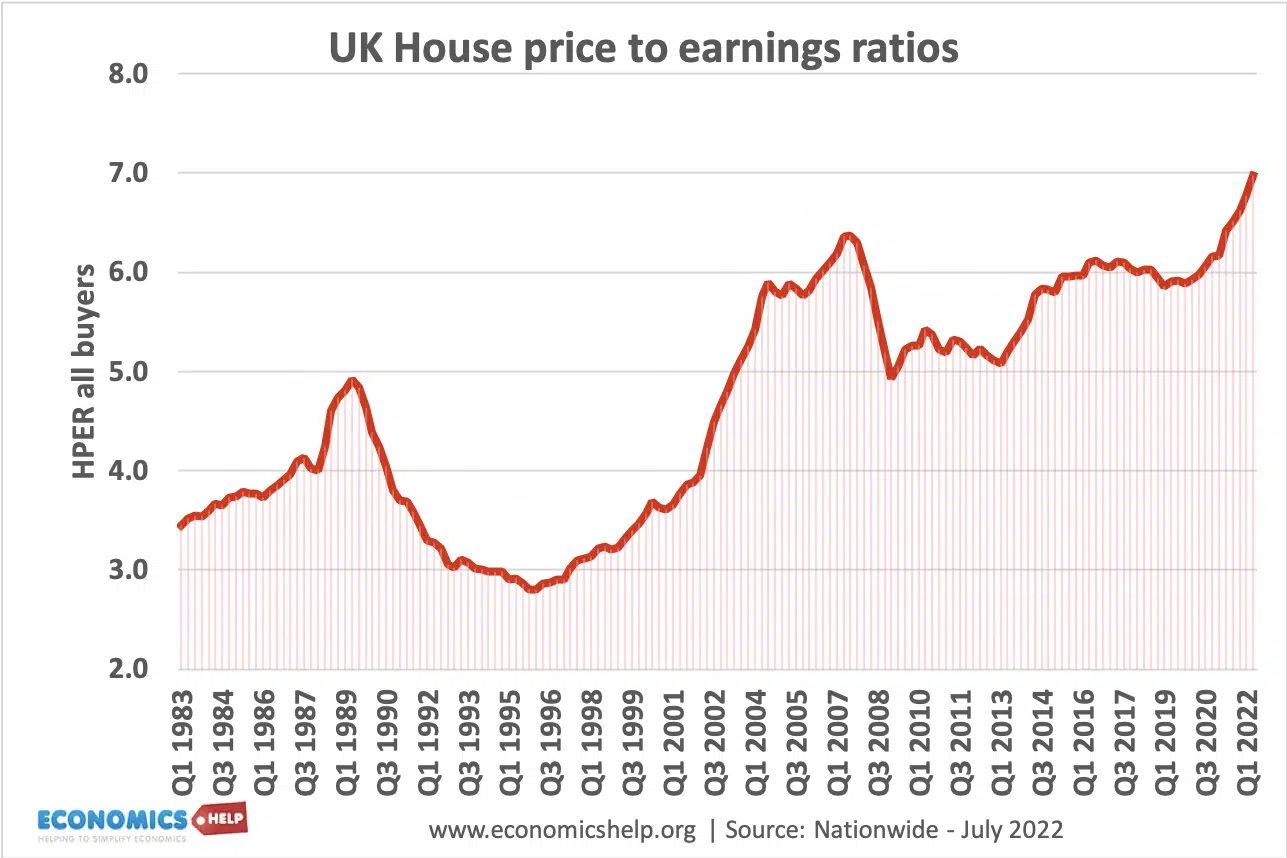
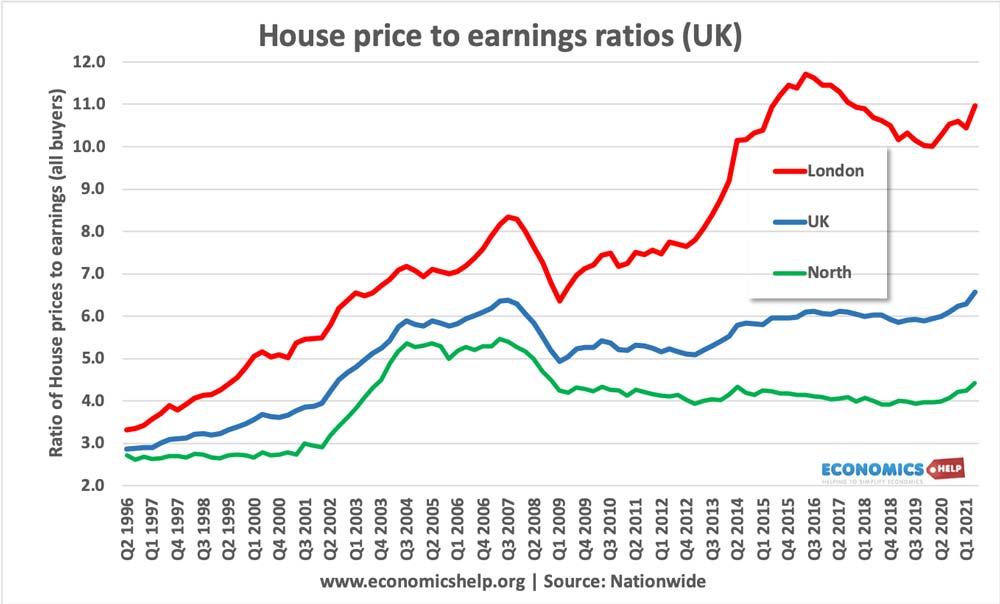
UK House price to earnings ratios (all buyers) reached a peak in 2022. Above the 2009 peak, which preceded the housing price falls.
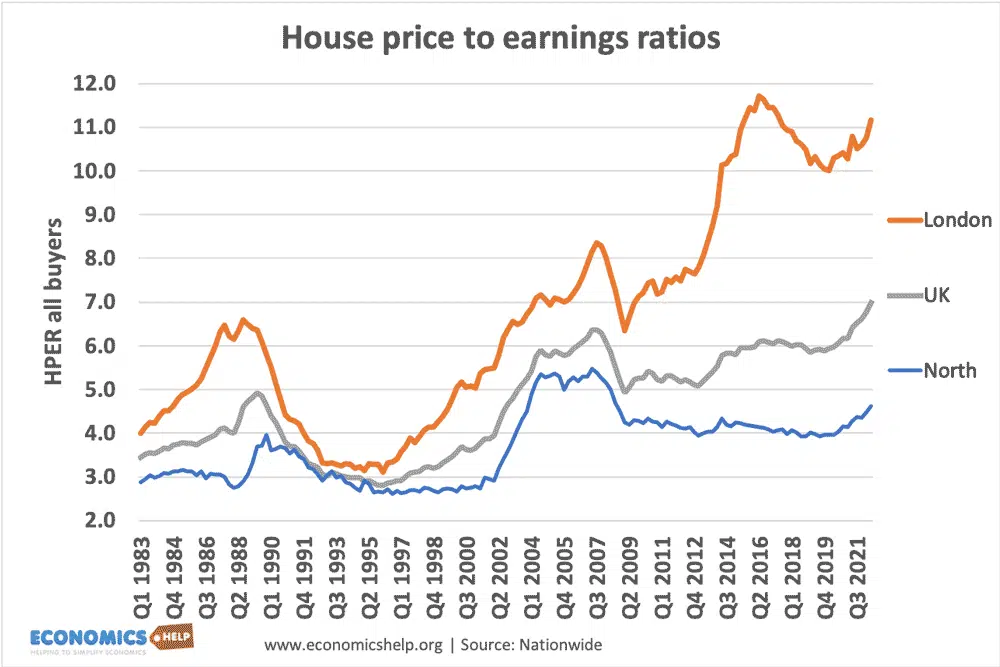
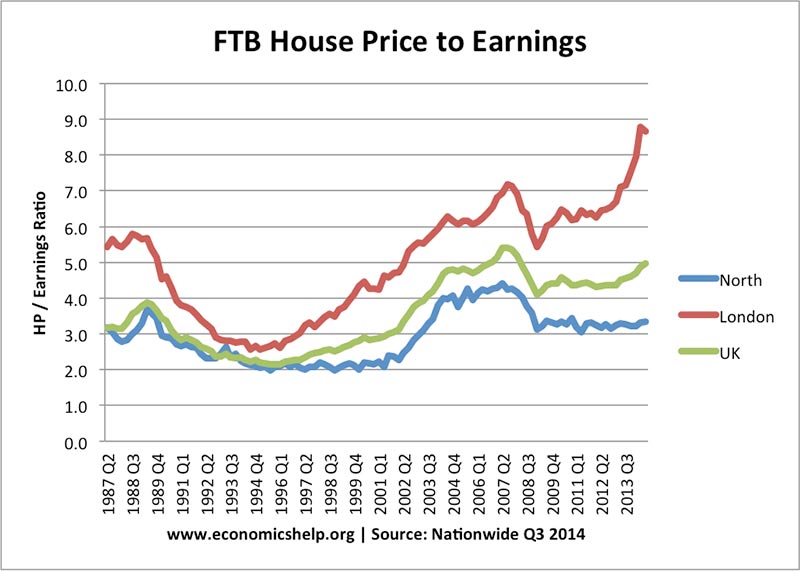
The house price to earnings ratio is most extreme in London, with the ratio reaching 11 times salary. Housing prices in the North, Scotland and Northern Ireland are relatively cheap.
In many parts of the country, potential buyers are being kept out of the market due to house prices being much higher than average incomes. For young people especially, owning a home has become increasingly unrealistic because the deposit required is out of reach for most workers.
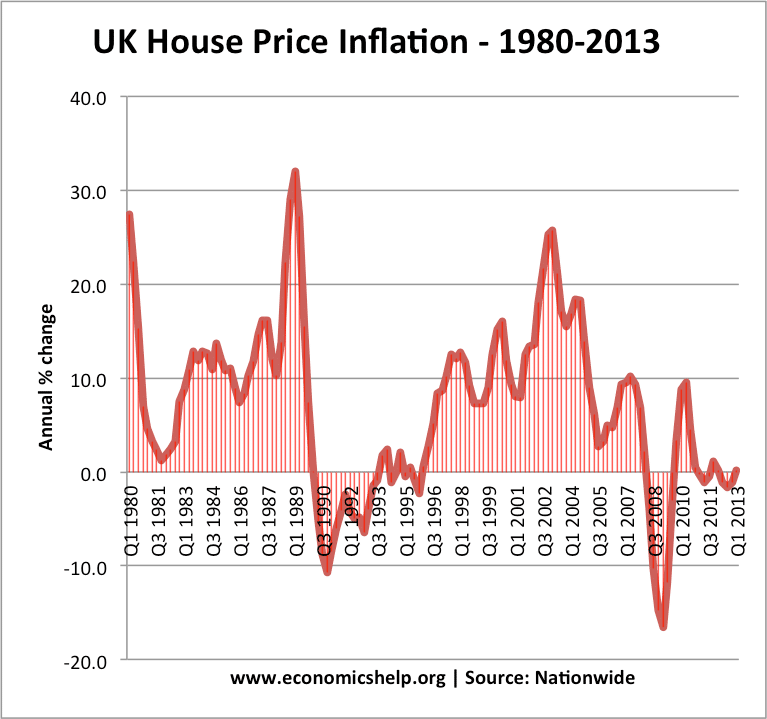
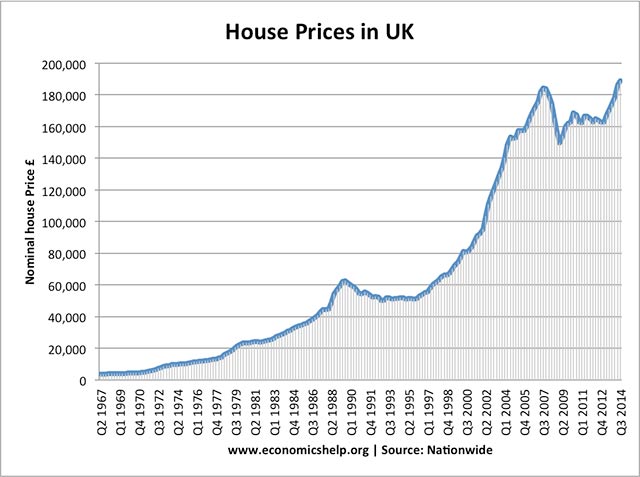
UK real house prices since 1975

This shows average house prices – adjusted for inflation. It shows that house prices have risen considerably faster than the average price level.
- The average UK house price was £271,000 in November 2021. ONS
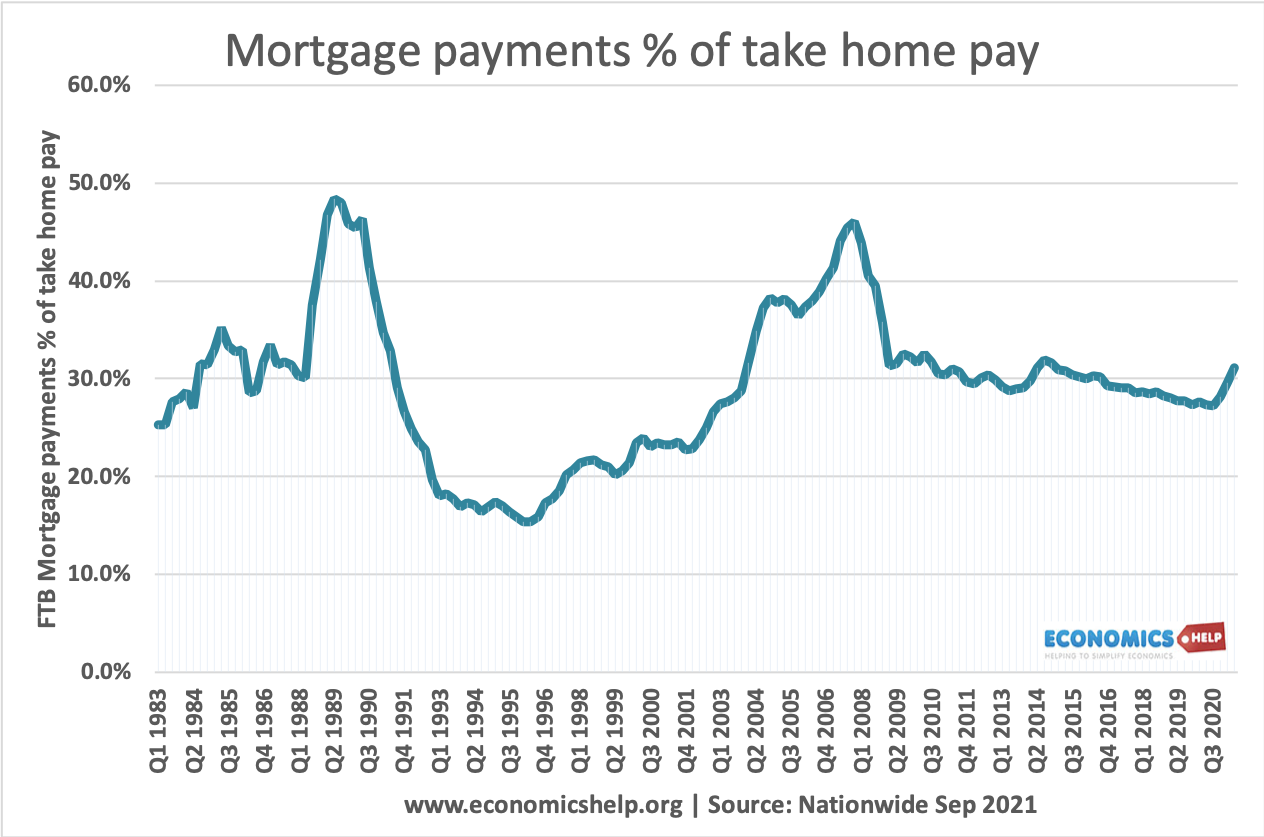
Mortgage payments as % of income
One useful measure of housing affordability is to look at mortgage payments as a percentage of income.
For first time buyers taking on large mortgages, the mortgage payments are still taking up a big % of take-home pay – despite the low-interest rates. The average mortgage payments are lower for average homeowners because many householders took out a mortgage when house prices were cheaper. In this regard, it doesn’t look too bad.

Since interest rates were cut in 2009, mortgage holders have benefitted from low-interest rates, which have made mortgage payments cheaper.
- However, when interest rates rise, many homeowners will see a nasty shock of rapidly rising mortgage payments.
- Also, rising house prices have required a bigger deposit. This means many who might be able to afford mortgage payments are unable to get a mortgage in the first place

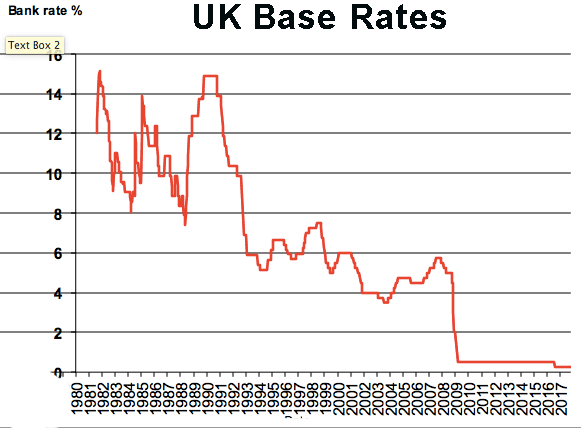
UK base rates are starting to rise from historical lows – which will increase the cost of mortgage payments.
The deposit required has risen particularly for first-time buyers. from 10% of purchase price in 1995 to 23% in 2012.
Video on UK Housing market

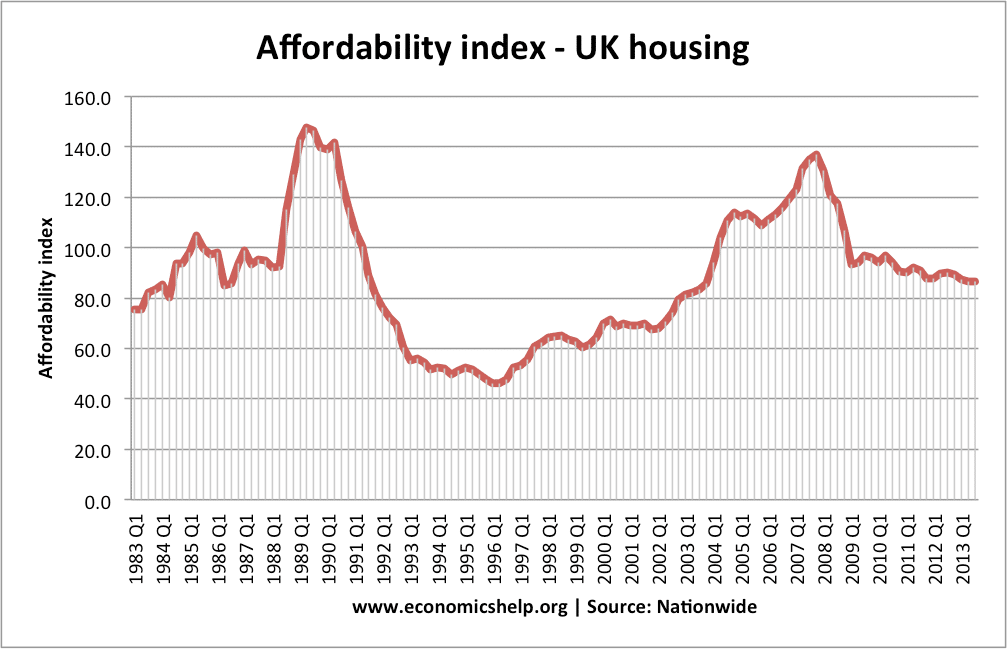
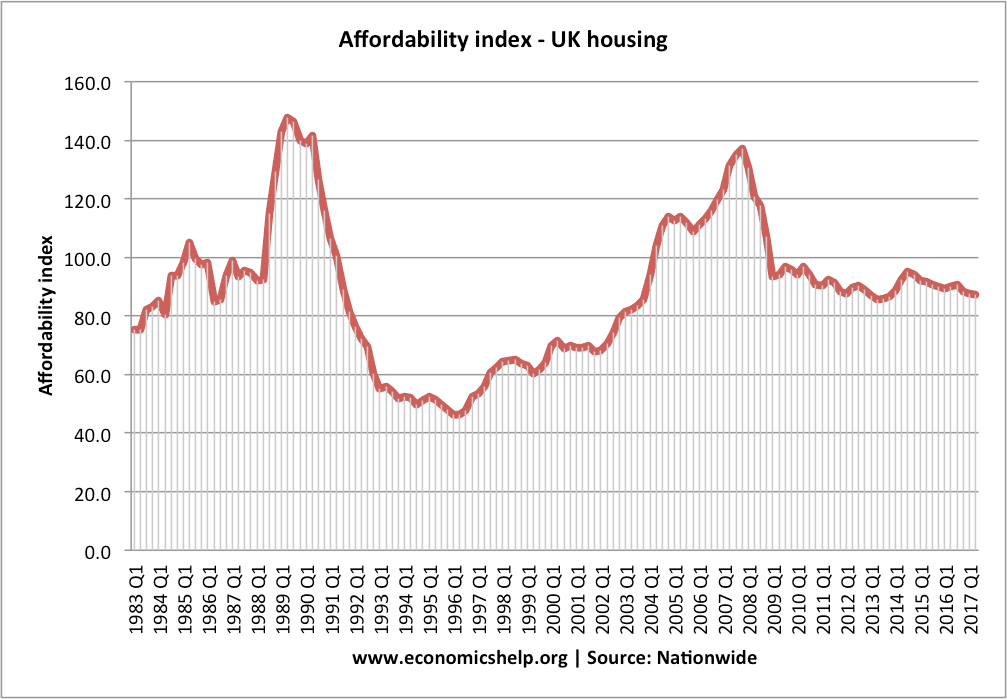
Affordability index
Median income of mortgage borrowers in UK

The graph shows a significant rise in average incomes of those with mortgages.
- In 1990, the proportion of people with mortgages on income of over £50,000 was 2.5%. In 2011, the proportion of mortgages by people with income of over £50,000 was 40%.
- In 2011, only 6.8% of people with mortgages had an income of less than £20,000. In 1990, 61% of people with mortgages had income less than £20,000
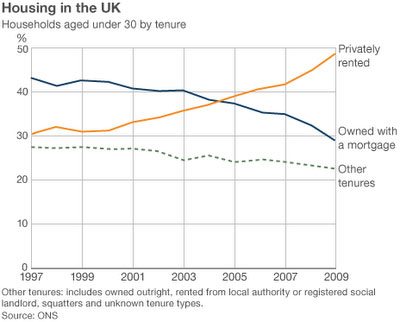
- There is a similar drop in the % of mortgages held by people under 30 years of age.
- Source: ONS House price index May 2012
- This data shows average house price to income ratios. It is based on the ONS mortgage survey.
- After peaking at a ratio of over 5.0 in 2007, there has been a surprisingly limited drop in the ratio of average house price to average incomes.
- The graph also shows that the average advance for buying a house has significantly increased. This is one factor in explaining why the average incomes of those with a mortgage have more than doubled in recent years.