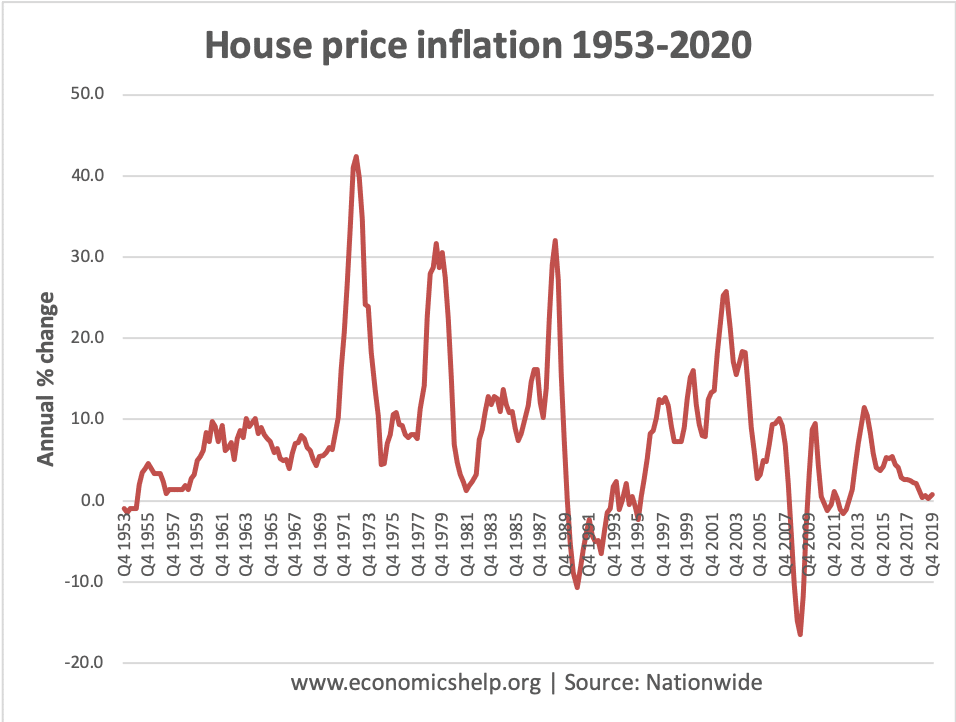
Annual house price inflation has slowed down since the Brexit referendum.
There has been a slight uptick in 2020 since the clear result of the election.
How did we end up with a broken housing market in the UK?
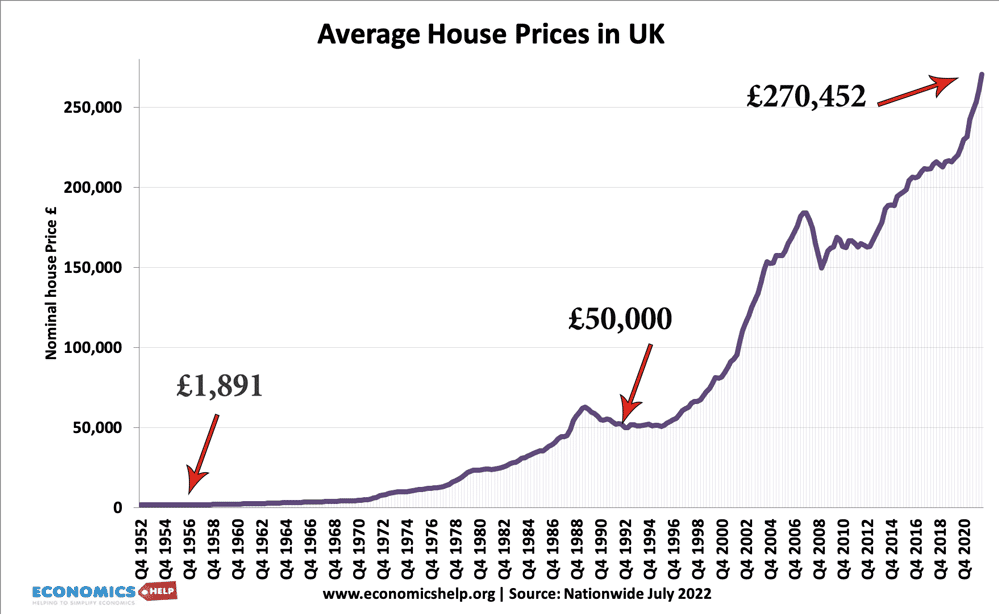
UK House prices in the past few decades
In 1969, average house prices were: £4,312
In 1975, average house prices were: £10,388.
In 1980, average house prices were: £22,676
In 2016, average house prices – £198,564.
In 2022, average house prices – £270,452
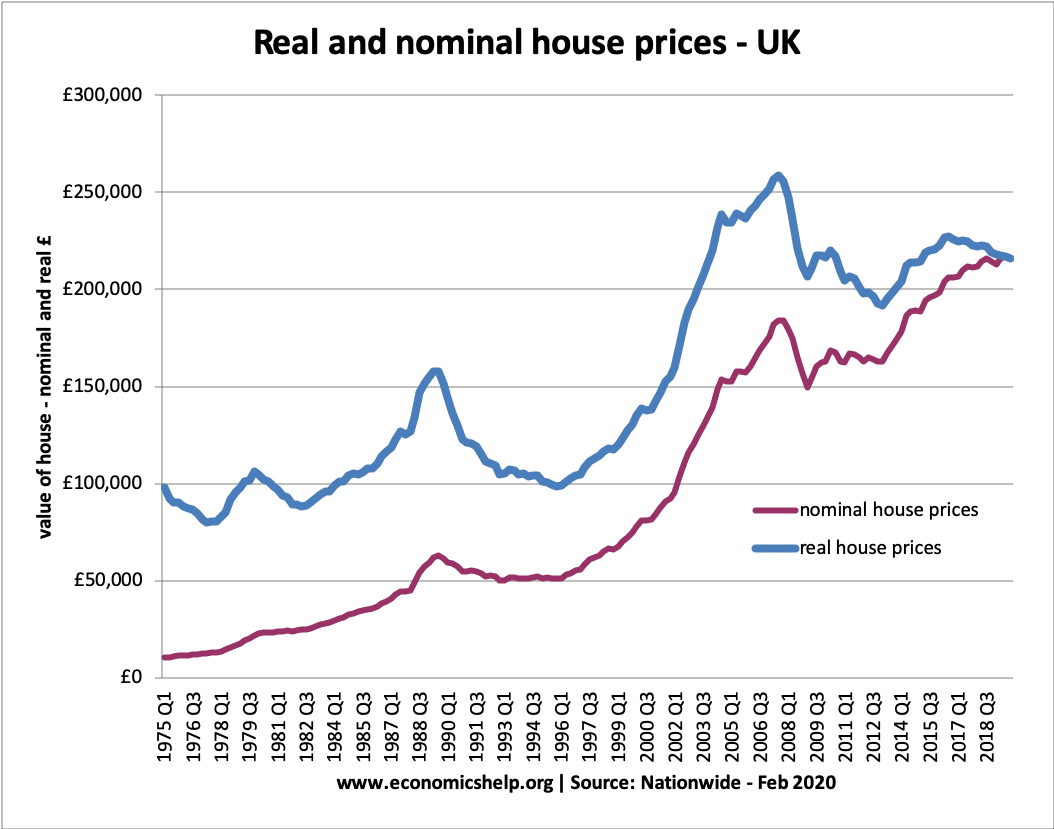
Real house prices
Real house prices are adjusted for the effects of inflation. This gives a more meaningful guide to how house prices have increased compared to typical prices in the economy.
This shows the real increase in house prices – rising faster than inflation.
In 1975 – average house prices (at 2014 prices) was £83,126.
In 2022 – average house prices – £270,000
225% increase in real house prices.
2. Affordability of Housing
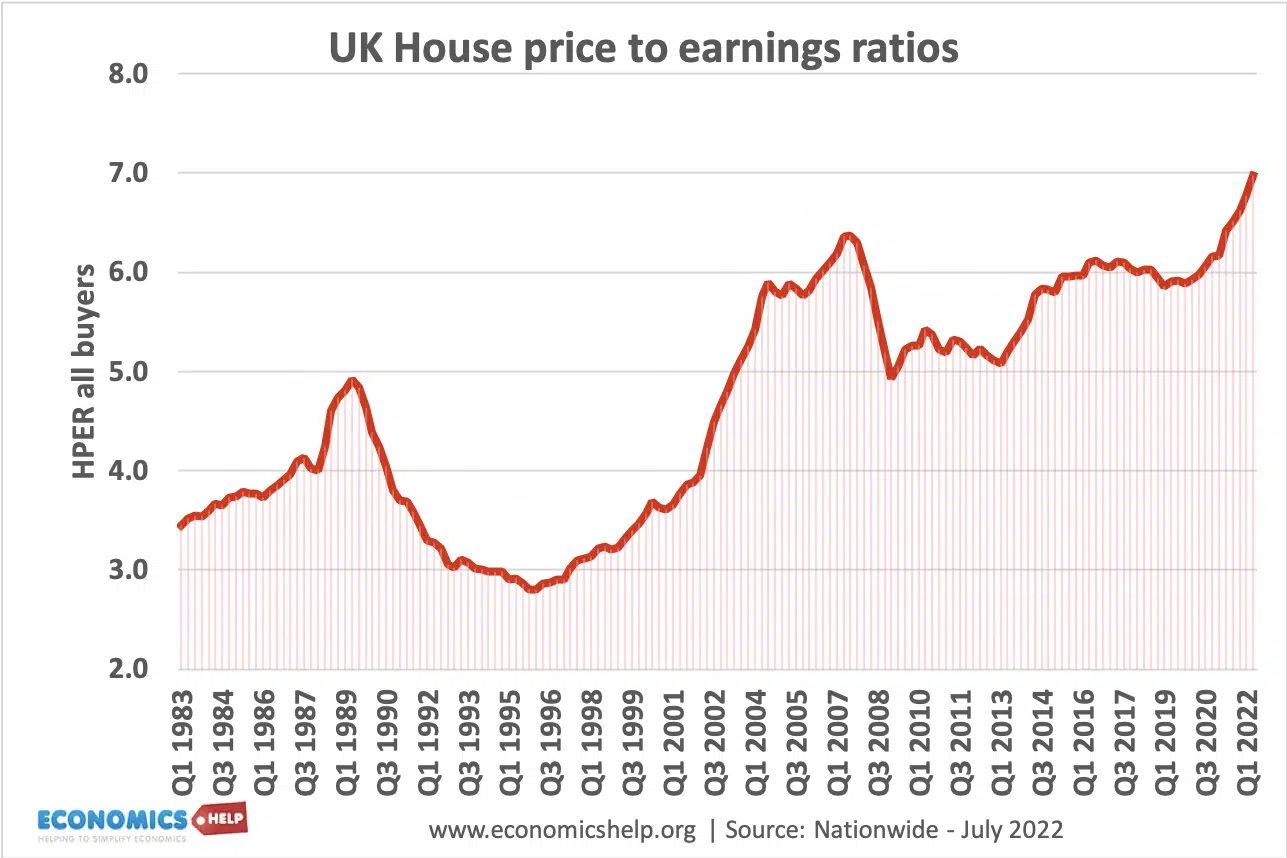
First Time Buyers – House Price to Earnings Ratio
For UK first time buyers, the average house price is 5 times average earnings. In London, house prices are 9 times average earnings, whereas, in the north, house prices are only 3.2 times average earnings.
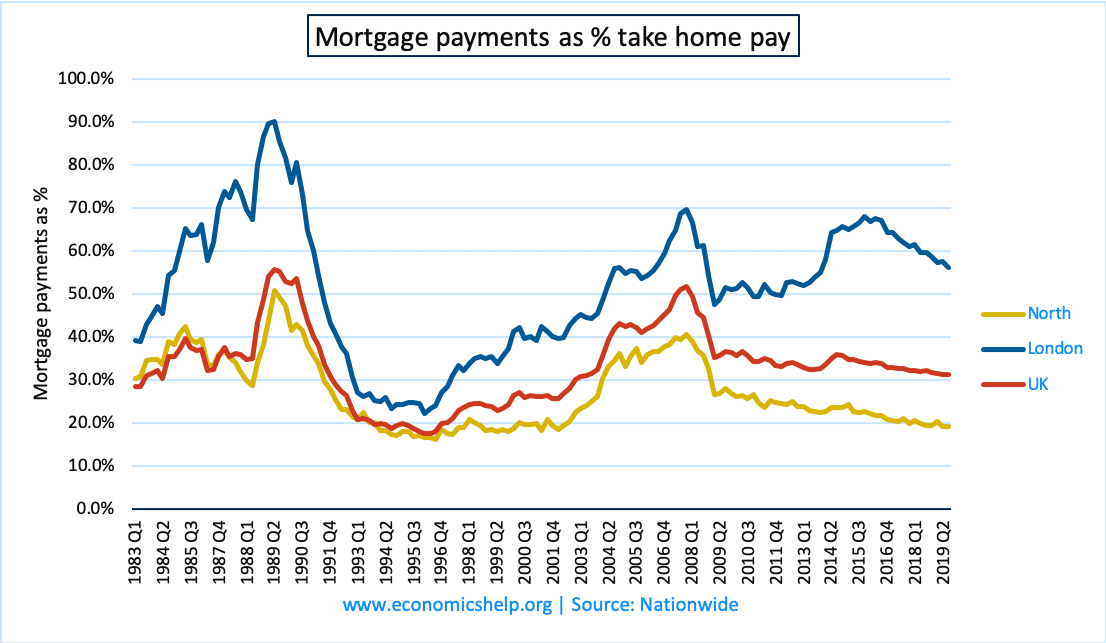
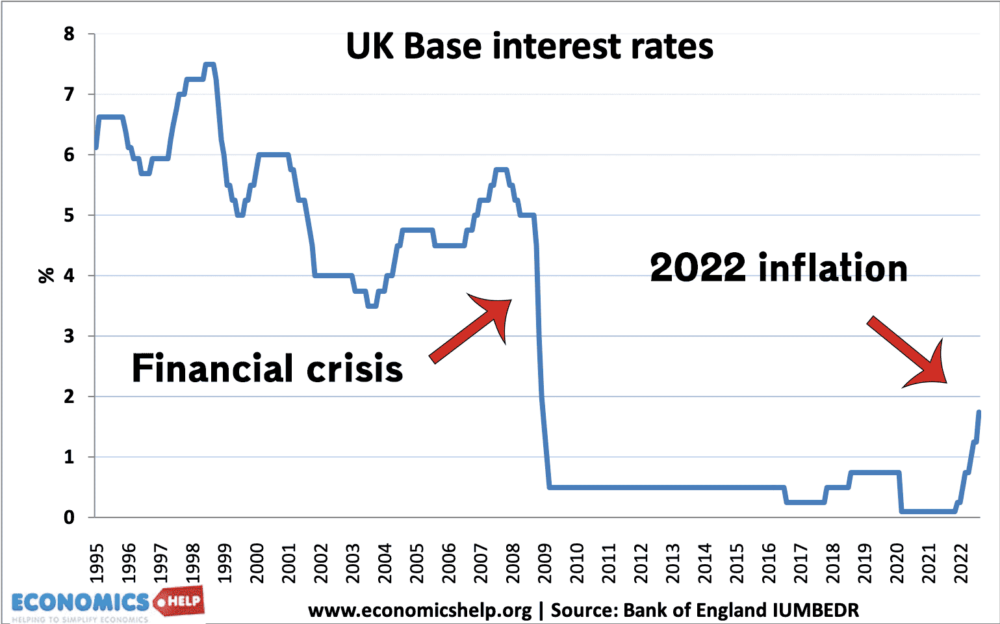
Affordability of Mortgage Payments
Mortgage payments as % of income reached a peak in late 1989/90 due to record high-interest rates. Rising house prices meant that the % of mortgage payments grew in the 2000s. However, in 2009, interest rates were cut to 0.5% leading to lower mortgage payments for homeowners.
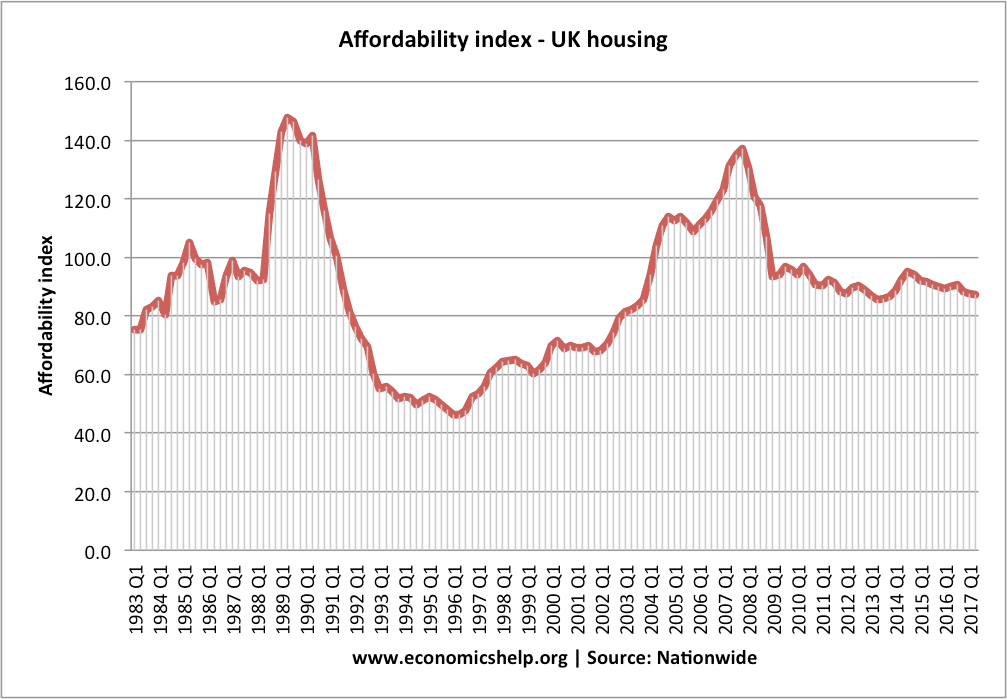
Affordability index
The nationwide also produce an affordability index. Index base year 1985=(100)
There has been a dramatic fall in Bank of England base rates (which has continued to remain at 0.5%) but the bank’s standard variable rates have fallen at a much lower rate. See more at explaining the gap between base rates and commercial lending rates.
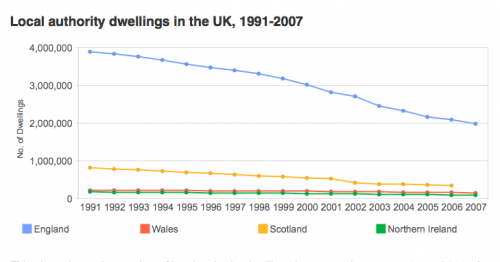
During the post-war period, construction of local government housing increased supply. Home builds reached over 400,00 a year in the late 1960s. However, from the 1980s, the government retreated from building houses, leaving it to the private sector and a small contribution from housing associations. Due to strict planning legislation, the supply of housing has failed to meet government targets.
For example, in 2007, the government estimated they would need to build 240,000 homes a year until 2016, to keep up with growing demand. However, after the credit crunch, housing completions fell to 100,00 a year.
Between 1950 and the early 1980s, the percentage of homes which were bought steadily increased, and the renting sector fell. Mrs Thatcher encouraged this trend in the 1980s, with a policy of encouraging home ownership and selling off council homes. Mrs Thatcher allowed the sale of council properties to their tenants. The stock of social housing has fallen since the early 1980s.
However, the trend in homeownership has been reversed in the last decade, due to the declining affordability of homeownership.
source: JRF Housing & Neighbourhood studies
local authority housing stock has plummeted due to the popular right to buy scheme and transfer of housing stock to housing associations.
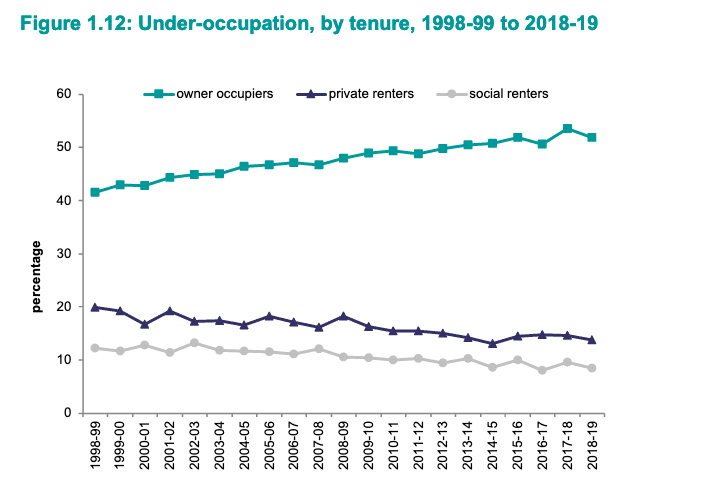
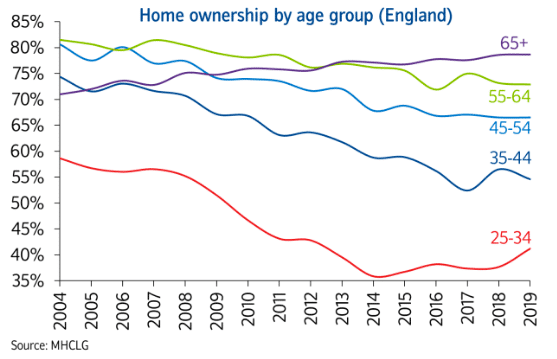
Inequality by age
Source: English Housing Survey 2018/19
The high house prices have led to a drop in homeonwership rates for young people.
The volatility of UK house prices. Though it should be noted these statistics show nominal house price changes. In the 1970s, high inflation rates magnified the nominal house price rises.
House prices adjusted for inflation
Even adjusted for inflation, we have seen strong growth in house prices. Real house prices
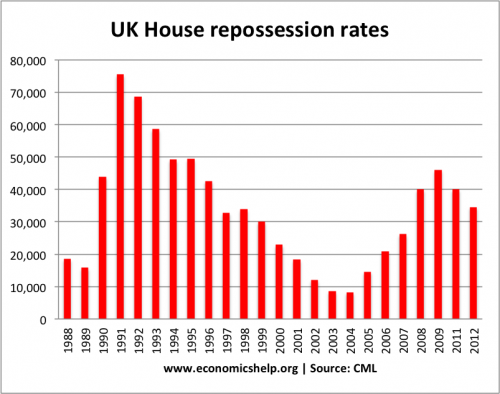
Mortgage defaults and arrears
Mortgage default rate statistics are produced by Council of mortgage lenders (CML). See repossession rates
Housing Benefits
Just under 5 million receive housing benefit, at an average of £93 a week. This is a rough annual cost of £23 billion.
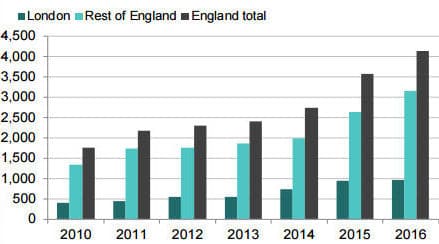
Regional house price graph was really useful for me. Now I’m comparing house prices in the UK and the USA. Medium property in the United Kingdom is a bit more expensive than one in America. But houses in London and San Francisco, frontrunners in their countries, cost approximately equally — 521K GBP and 785K US dollars. Making a research I used date from the source https://tranio.com/usa/analytics/house_prices_rental_rates_and_yields_on_americas_top_residential_markets/
Is there a chart for number of transactions, ideally going back up to 30 years?
This covers recent years back before the financial crash:
i would be interested to see some of these graphs (i.e. affordability compared to income) up to 2016,
concerned about the inevitable bubble, with people buying up second homes because ‘theres no better investment than property’ would be interesting to see if it compares with 2005-2007. may be helpful in predicting the next burst of the bubble.
of course it could be on thursday if we leave the e.u.!
As with a previous commenter, it would be interesting to see income levels versus rent levels and house prices, over say the last 10 years, but by city.
Using Bristol as an example, house prices have increased and rent levels have gone up way beyond what Housing Benefit will pay. As a result, rent is unaffordable – let alone deposits, and there has been a huge increase in homelessness applications.
However, since the number of local authority properties is declining, there are less options available. Resulting in 10,000 people on the waiting list for housing – and that’s after the city council culled 5,000 people that had ‘no chance’ of being successful in obtaining an LA property.
People are increasingly unable to afford to live in the city in which they work, as has happened with London. However, income in London seems to be adjusted to accommodate this when elsewhere income doesn’t seem to have increased to anywhere near enough to keep up.
Is the same thing happening in a city of a similar size such as Sheffield, Leicester or Derby. Are people being priced out of cities? Is there a difference in the economy growth rates between cities?
This is a very interesting study! It will be beneficial for those who are planning to buy properties in UK. They can now compare prices and trends in different places in UK.
Great news for those looking to sell, but in many places it presents more of a barrier for anybody trying to move up the property ladder. How many people are now being priced out of these areas?
It would be interesting to see income levels versus rent levels and house prices, over say the last 10 years, but by city.
Regional house price graph is really useful. It seems a average house price to average earning ratio of 5.1 times is the level at which we see prices topping out broadly speaking with the exception of london.
Is there any graphs on supply and demand in the housing market in recent years?


Regional house price graph was really useful for me. Now I’m comparing house prices in the UK and the USA. Medium property in the United Kingdom is a bit more expensive than one in America. But houses in London and San Francisco, frontrunners in their countries, cost approximately equally — 521K GBP and 785K US dollars. Making a research I used date from the source https://tranio.com/usa/analytics/house_prices_rental_rates_and_yields_on_americas_top_residential_markets/
Is there a chart for number of transactions, ideally going back up to 30 years?
This covers recent years back before the financial crash:
http://a.disquscdn.com/uploads/mediaembed/images/2649/6953/original.jpg
i would be interested to see some of these graphs (i.e. affordability compared to income) up to 2016,
concerned about the inevitable bubble, with people buying up second homes because ‘theres no better investment than property’ would be interesting to see if it compares with 2005-2007. may be helpful in predicting the next burst of the bubble.
of course it could be on thursday if we leave the e.u.!
As with a previous commenter, it would be interesting to see income levels versus rent levels and house prices, over say the last 10 years, but by city.
Using Bristol as an example, house prices have increased and rent levels have gone up way beyond what Housing Benefit will pay. As a result, rent is unaffordable – let alone deposits, and there has been a huge increase in homelessness applications.
However, since the number of local authority properties is declining, there are less options available. Resulting in 10,000 people on the waiting list for housing – and that’s after the city council culled 5,000 people that had ‘no chance’ of being successful in obtaining an LA property.
People are increasingly unable to afford to live in the city in which they work, as has happened with London. However, income in London seems to be adjusted to accommodate this when elsewhere income doesn’t seem to have increased to anywhere near enough to keep up.
Is the same thing happening in a city of a similar size such as Sheffield, Leicester or Derby. Are people being priced out of cities? Is there a difference in the economy growth rates between cities?
This is a very interesting study! It will be beneficial for those who are planning to buy properties in UK. They can now compare prices and trends in different places in UK.
Great news for those looking to sell, but in many places it presents more of a barrier for anybody trying to move up the property ladder. How many people are now being priced out of these areas?
It would be interesting to see income levels versus rent levels and house prices, over say the last 10 years, but by city.
Regional house price graph is really useful.
It seems a average house price to average earning ratio of 5.1 times is the level at which we see prices topping out broadly speaking with the exception of london.
Is there any graphs on supply and demand in the housing market in recent years?