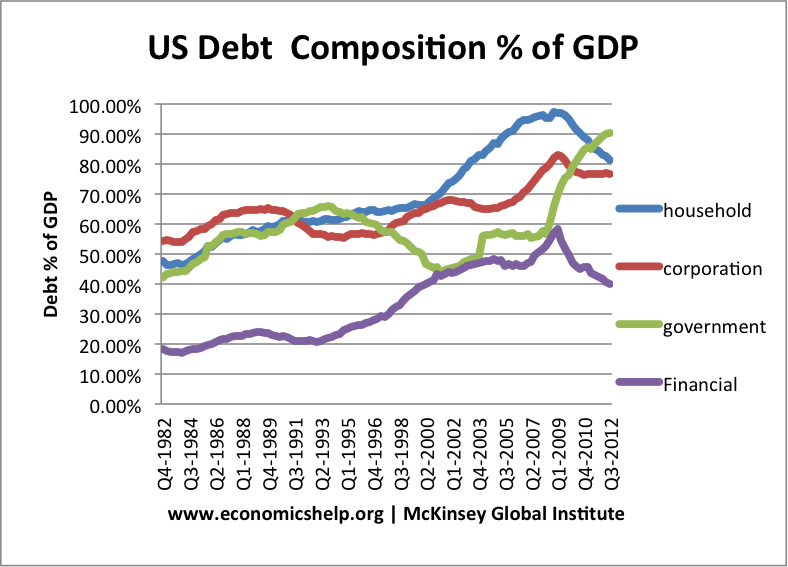
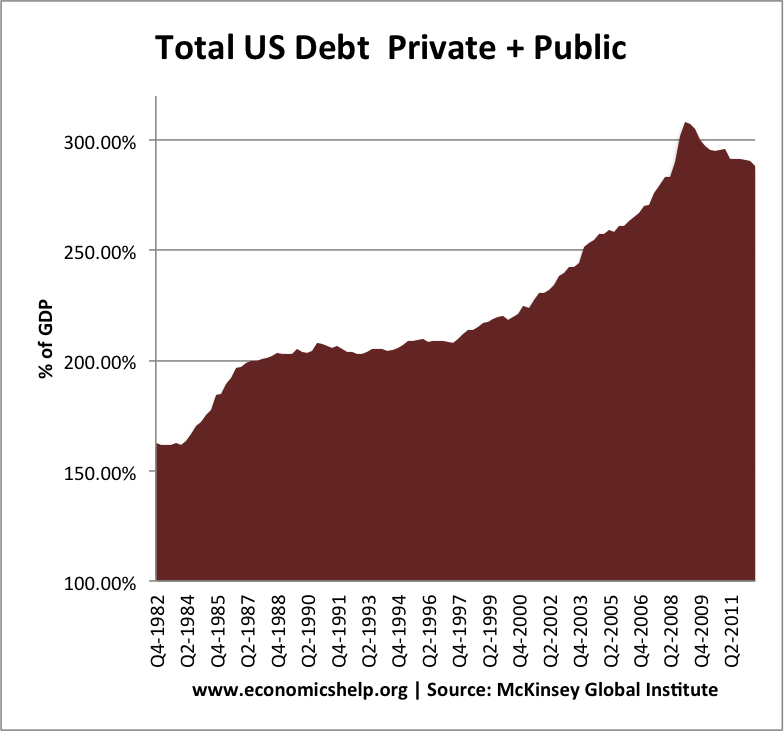
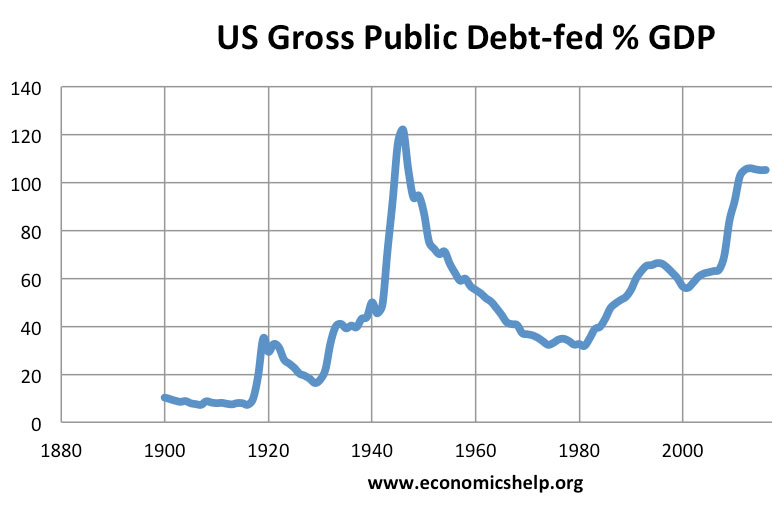
Recently, there has been much focus on US public sector debt – the total amount the government borrows. These graphs show the combined debt levels of both the public and private sector. Private sector debt is split up into households, non-financial companies and financial corporations.

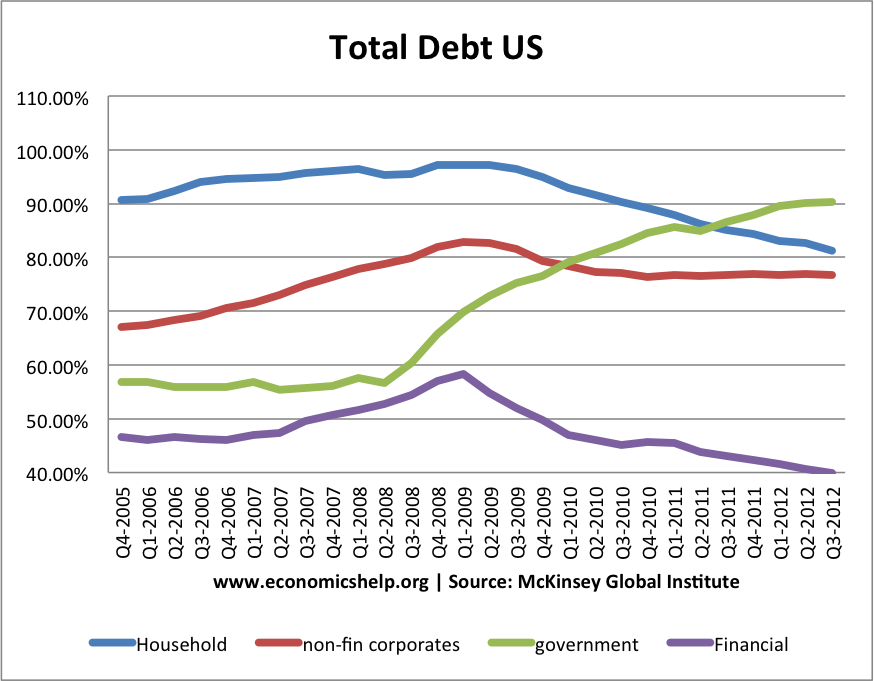
In the run up to the 2007 financial crash, we have a rise in total debt levels. – especially amongst households, and financial. Note debt to GDP continues to rise in 2008/09 – because GDP fell sharply in these years.
From 2009, we see a fall in debt levels in the private sector (non-financial corporations, financial firms and households all see lower debt to GDP). This is what you would expect in the aftermath of credit crisis, housing slump and recession – firms and households seek to improve their balance sheets – pay down debt, increase saving, reduce investment and reduce consumer spending.
From 2008 to 2012, US government debt increases from below 60% to 90% of GDP. But, placed in this context of falling debt levels in other areas of the economy, it sheds a different light.
Undoubtedly, the rise in US government debt helped to offset the fall in private sector spending and investment. If the government, had attempted to reduce the budget at a quicker rate or if they had attempted to maintain government debt at some pre-determined level (e.g. 60% is often mentioned in Eurozone targets), the US wouldn’t be seeing the economic recovery it is seeing. (e.g. US vs EU unemployment)
A very crude and simplified explanation of Keynesian economics is that falling private sector spending should be offset by rising government spending – even if the government has to borrow from the private sector.
The fact that the private sector is wanting to pay down debt and increase savings, means that there is higher demand for government bonds, and this is why bond yields have fallen during this period of rising government debt.

Total US debt has actually fallen from 2008 – a marked contrast to the previous two decades.

What are the implications of this?
- If the private sector is deleveraging – cutting back on spending and investment to pay down debt, it is important that the government take the slack.
- Debt may be bad. But, that doesn’t mean the highest priority should be to cut debt as quickly as possible.
- The steady reduction in total US debt means the economy is becoming more rebalanced – though there may be a considerable way to go.
- These statistics show debt to GDP because that is the most meaningful way of examining the burden of the debt. There are of course two ways to reduce debt to GDP. 1) reduce debt levels 2) Increase GDP. The fact that the US economy is showing economic growth (even if weak) will help significantly to reduce debt to GDP ratios without imposing an unnecessary debt deflationary spiral on the economy.
- In the talks on the US fiscal cliff and US debt ceiling, there is often a focus on government debt – ignoring other sectors of the economy.
- The growth in total debt from 1982 to 2008 was a warning signal that there was greater potential imbalances in the economy. However, it is hard to make too many generalisations just from raw debt statistics. For example, it depends on the type of debt that is increasing. Is the debt secured against quality assets, is the debt sustainable?
- For example, in the US, the fact that household debt was secured against increasingly shaky asset prices (housing bubble) and very risky mortgage loans, meant there were the seeds for a crisis and debt overhang.
Related
Data source: Debt and deleveraging, McKinsey Global institute


A most important topic.
The numbers on your graphs look low to me. I think McKinsey sees it as double-counting, to include financial debt, and perhaps they found reasons to reduce it.
In an old Seeking Alpha post, ContraHour shows total US debt above 350% of GDP at peak. And the third graph there shows “domestic financial” debt at the largest of the components.
http://seekingalpha.com/article/116929-u-s-domestic-debt-what-can-be-expanded-what-must-be-reduced
Regarding your Implications: Agreed, and good insights. Particularly important to point out that private debt is ignored in all the political discussions!
RE Implication #4: Yes, growth is the escape route of choice. The focus of my work is to show that debt hinders growth. So it is not easy to grow out of debt, particularly in an economy designed to use credit for growth
An economy designed, really, to use credit for everything.
RE Implication #6: “The growth in total debt from 1982 to 2008 was a warning…”
Yes it was. But the growth of total debt BEFORE 1982 was approximately as rapid as the growth 1982-2008. What changed was inflation. Before 1982 inflation was eroding old debt quickly, so that total debt seemed to accumulate slowly.
http://newarthurianeconomics.blogspot.com/2012/06/by-numbers-2-history-is-different.html
Everyone evaluates debt growth as you do. And to be sure, the burden of debt can be reduced by inflating income. But “debt growth” did not suddenly increase in the 1980s. Debt growth was always rapid. And it started having deleterious effects early on, possibly as early as the 1960s.
Thank you Tejvan.
Art
United States debt is equal to the total debt of a company. Currently, it is $16.3 trillion, wherein, on 14th Feb 2013, it was around $11.684 trillion, that is almost 74% of GDP. The debt of the country has been high during the year 1945-46, wherein, it reached up to 109%. As per the statistical data so far, it has been seen that there has been a rise in the last decade at an average rate of 90.3% annually that is from 2000 to 2011. This rate when compared to the GDP was found to be increased by 1.8% during the same period.