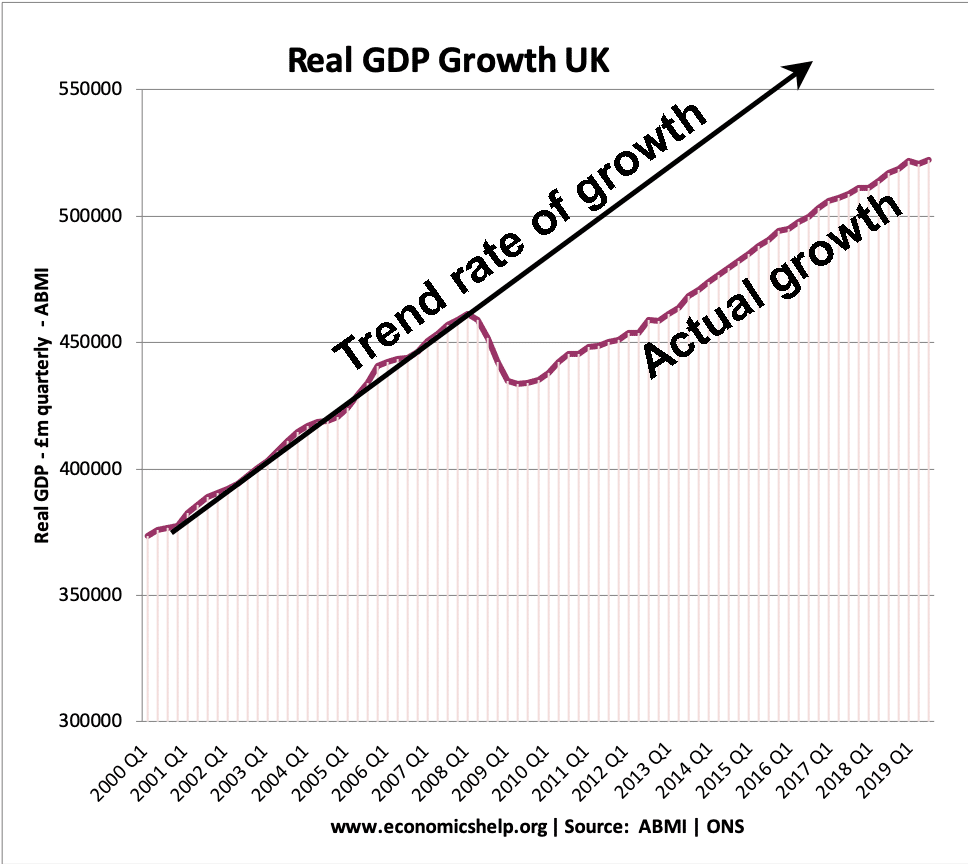
Expected and Actual Recovery in the UK 2012

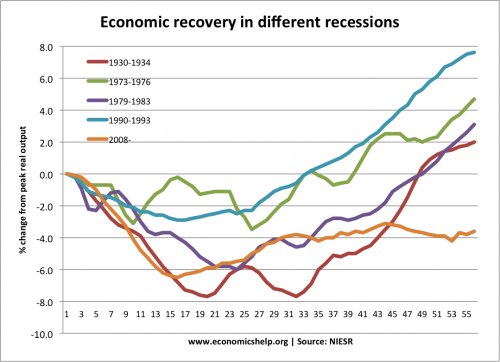
There is hope that the UK may officially be leaving the current recession (for the second time). However, this recovery needs to be put into perspective in to what kind of recovery should we have been expecting?

Interesting research by  Moritz Schularick, Alan Taylor, 24 October 2012 on this post- “What should we have expected in terms of economic recovery?

Expected and actual recovery UK economy

They look at the nature of the recession and examine what kind of recovery might have been expected. Also, they compare the UK recovery to the US. A few notes:

  • Both economies experienced a deep financial crisis. With excess credit overhang, you would expect a longer recession than say 1981 or 1991 when the recessions were caused by monetary and or fiscal tightening.
  • However, even allowing for the nature of the balance sheet recession, we should have expected to see a much quicker and stronger recovery from the UK.
  • The pink lines show the area of expected economic recovery, the blue line shows actual Real GDP growth.
  • The US has slightly exceeded expectations – true US unemployment is still high, but given the nature of the recession, they are perhaps doing reasonably well.
  • The UK by contrast has completely underperformed.  In particular, the economic growth rate since 2009 is very disappointing.
  • My only criticism of the research is that they set the bar fairly low. Previous financial recessions involved significant mistakes in fiscal and monetary policy. Mistakes we have tended to repeat.

Read more

Slight Variations in Economic Data

Readers Question: Hi and thanks for your article “UK Budget Deficit”. I am ‘new’ to economics, but trying to do my bit to get to understand it all. From your article I followed links and found the ”Pocket DataBank” published by the treasury. Being a bit retentive about things, I tend to learn by adding things up, and if I my total matches published totals, then I know I’ve understood things correctly.I got confused on tables 11A & 11b

On 11a, I found:
“FINANCIAL YEAR PUBLIC SECTOR BORROWING FIGURES (£ billion) >> Net Borrowing (ANNX) 2011/12″ = -123.8bn

But on 11b, it says
“PUBLIC SECTOR NET BORROWING (J5II) 2011/12″ = 124.7

And then your article quotes £119.3 billion

Would you be able to help me understand the differences?

I spend a lot of time researching data on government borrowing. It is definitely complicated by the fact that there are many different variations – different data series – of essentially the same thing. I once spent a long time researching debt statistics and came up with this post. Understanding debt statistics – but even that does not include every variation of the many different series and data tables. It does frustrate myself too.

I don’t want to further confuse you, but if you look at ONS site (the main place I go for statistics, you will see public sector net borrowing).

In 2011/12 public sector net borrowing was £121.6 billion; this is £4.4 billion lower than the Office for Budget Responsibility (OBR) forecasted net borrowing for 2011/12 of £126.0 billion

so that’s a 4th version to throw into the mix.

Read more

How the Budget Deficit was cut by 25%?

The government have repeatedly pointed to their ‘achievement’ of cutting the budget deficit by 25% in the past two years. But, how has this been achieved? and has it actually helped the UK economy?

borrowing

UK Net Borrowing

2007-08£40.3bn
2008-09£104.2bn
2009-10£167.4bn
2010-11£145.1bn
2011-12£119.3bn
2012-13£127.3bn – estimated

This shows a 25% fall in annual borrowing between 2009-10 and 2011-12.

(Net borrowing – is the annual amount the government have to borrow. The amount spending exceeds tax revenue.)

public-sector-net-investment-hm-treasury

Public Sector Net investment – HM Treasury psf

Read more

UK Retail Sales Oct 2012

The amount of UK retail sales increased by 2.5% in the 12 months from September 2011 to September 2012. This measure includes the amount (quantity) of goods in all retailing, seasonally adjusted. The amount spent (value of goods) increased by 3.2% Annual store price inflation was estimated to be 0.7 %. This suggests that the …

Read more

Why Do Some Countries Create Money?

Readers Question: Why is it, that some countries e.g USA, UK, Japan etc can electronically create money whereas India, Germany, Euro etc have to work, trade and manufacture exports and growth to keep pace with the above mentioned ?

Any country could electronically create money if they wanted to. To summarise, the only good time to create money is when the economy is in a liquidity trap – a deep recession where even low interest rates fail to close the output gap.

The US, UK and Japan have pursued quantitative easing because the recession of 2008-12 was very deep and conventional monetary policy seemed ineffective in ending the recession.

Arguably, Quantitative easing would have been more successful in UK and US if it had been combined with expansionary fiscal policy or giving to consumers directly. But, the hope was creating money electronically (quantitative easing) would lower long term interest rates, increase bank lending and promote economic recovery.

It is important to bear in mind, creating money doesn’t create any actual output. It’s purpose is to increase demand and help unemployed resources to become better utilized.

Why doesn’t the Eurozone create money electronically?

The ECB is much more reluctant to create money. In the past, they have argued that constitutionally they cannot (though this has become somewhat more blurred recently) . The big fear that Europe (and Germany especially) have is that creating money will cause inflation. Therefore, the ECB have been reluctant to pursue quantitative easing to help the economic malaise.

Read more

OBR Admit Failure to Predict the Double Dip Recession

One feature of the current economic malaise is that growth predictions for the UK economy have been consistently over-optimistic. For example, the Office for Budget Responsibility originally forecast economic growth of 5.7% between 2010 to mid 2012. The economy failed to meet this target, growing by just 0.9% during this period. To be fair to …

Read more

Top Energy Sources in the UK

A look at the changing profile of energy production in the UK.

Energy Sources in UK

In the early 1960s, coal provided 81% of UK energy needs By 2010, this had fallen to 30%. At peak times in cold winters, coal use can increase to 40% of the UK’s electricity production. Despite a revival in coal production in the last year. A third of our current coal power stations are expected to close by 2016 so that they meet EU air quality legislation.

coal-output-solid-fuels-co2

The % of electricity from coal has continued to fall. (The big drop in 1984 was the coal miners strike.)

Read more

Chinese Currency Manipulation

The Chinese government have been criticised for the ‘manipulation’ of their currency. They would prefer not to use the word ‘manipulation’ perhaps they have an unofficial exchange rate target to keep Chinese currency undervalued to promote growth and exports. At the moment China only pegs its currency against the dollar and not a wider basket …

Read more

Item added to cart.
0 items - £0.00