
- Economic growth measures the change in real GDP (national income adjusted for inflation; ONS call it chained volume measure of GDP)
- The rate of economic growth is the % change in real GDP.
- Between 1945 to 2008, the UK economy grew on average by around 2.5% a year.
- Since the financial crisis (2007- ) the UK economy has grown in fits and starts, averaging around just 1%. Per capita growth has been even lower.

Another way of showing economic growth is the increase in real GDP.
Annual Rate of Economic Growth 1956-25

This shows the annual rate of economic growth; although it is volatile, the trend rate of economic growth has been in decline. Note, this graph shows GDP per capita (which takes into account population)
Another way of showing this is the rate of economic growth per decade
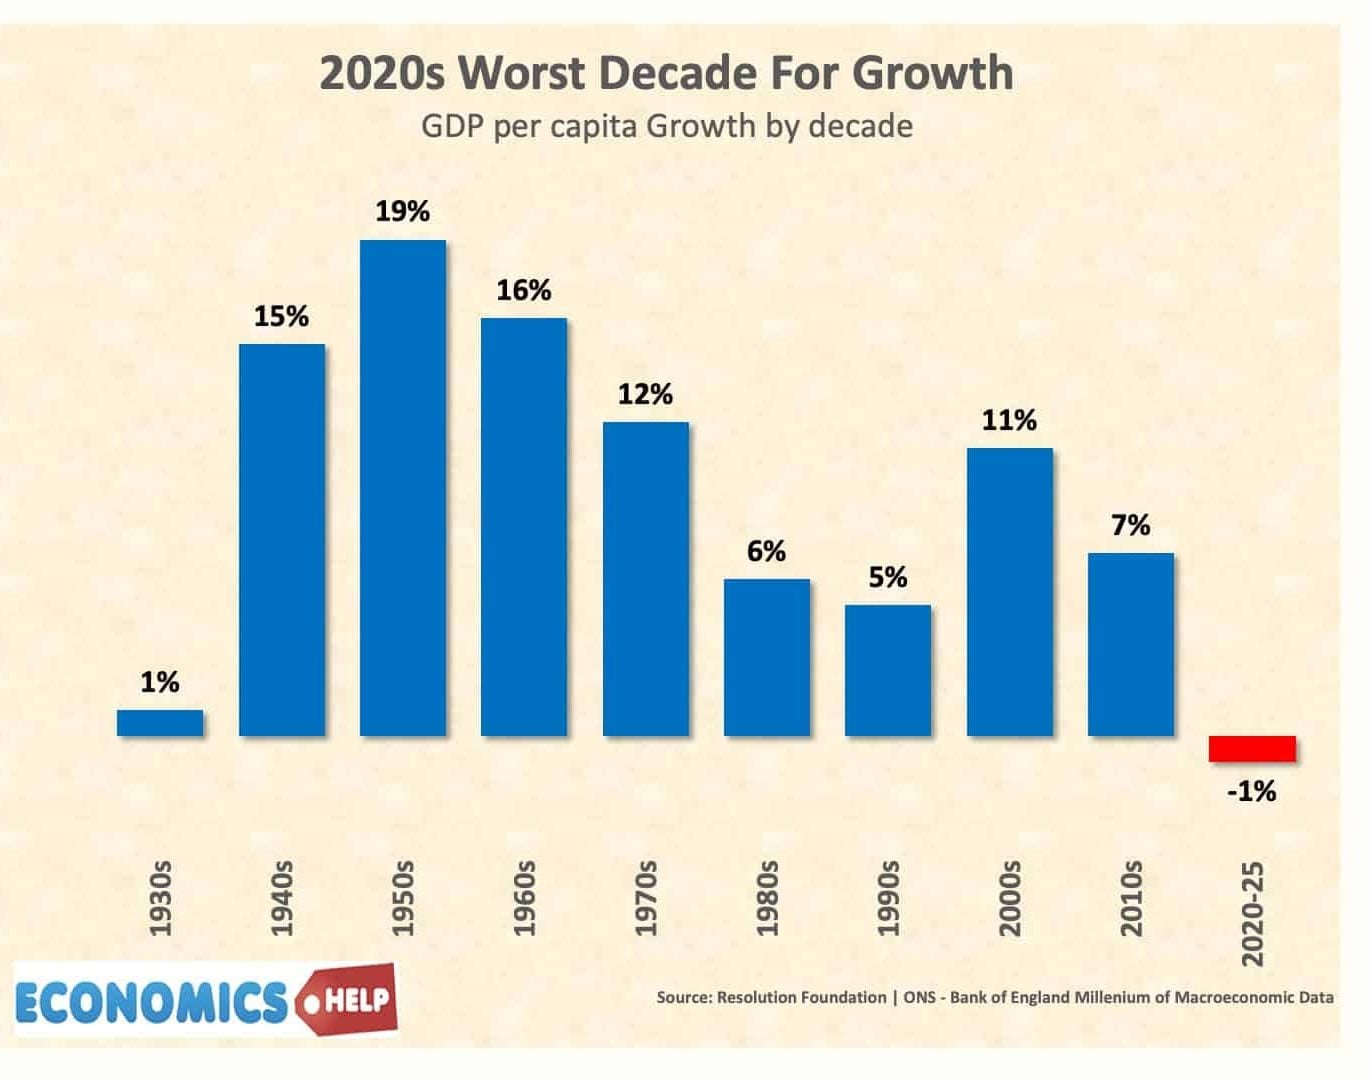
Growth per capita
Per capita means real GDP/population.

Source: ONS GDP chained volume | Raw data: real GDP (IHYQ) quarterly | Real GDP per Capita (IHXW)
With population growth averaging around 0.6 – 0.8% a year (about 50% of population growth is caused by net migration), real GDP is boosted by this growth in population. Real GDP per capita and average incomes are growing at a slower rate
Recent history of economic growth
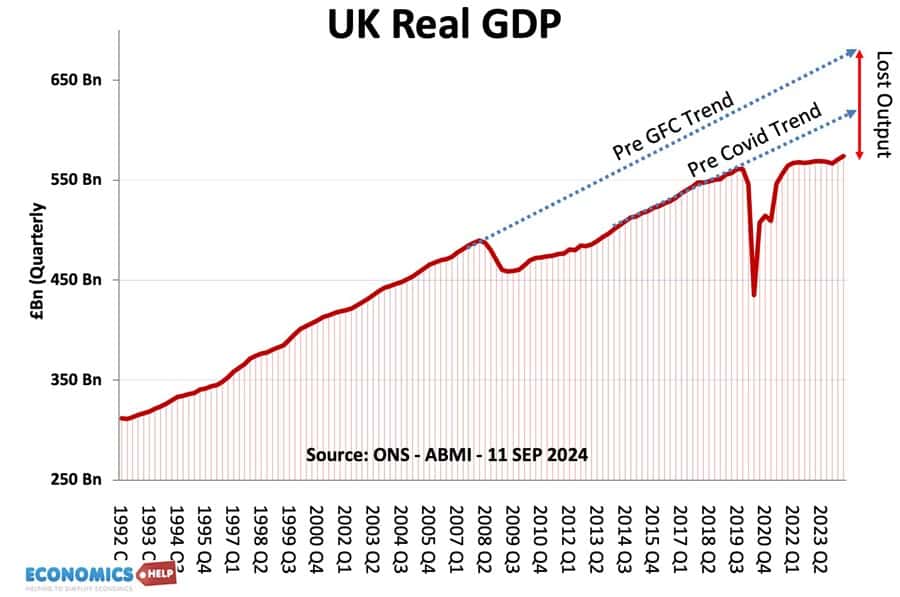
Source: ONS – ABMI
- Since the recession of 1992 ended, the UK experienced a long period of economic growth – it was the longest period of economic growth on expansion. Also, the growth avoided the inflationary booms of the previous decades. However, the credit crunch of 2007-08 hit the UK economy hard and caused a steeper drop in real GDP than even the great depression of the 1930s. Helped by a loosening of monetary and fiscal policy, the UK experienced a partial recovery in 2010 and 2011. But, by Q1 2012, the UK was back in recession.
- The second double-dip recession was caused by a variety of factors including the European recession, lower confidence caused by austerity measures, continued weakness of bank lending and falling real incomes.
- After Brexit, the UK has slowed down. This also co-incides with the period of Cvoid, the growth rate has been much lower.
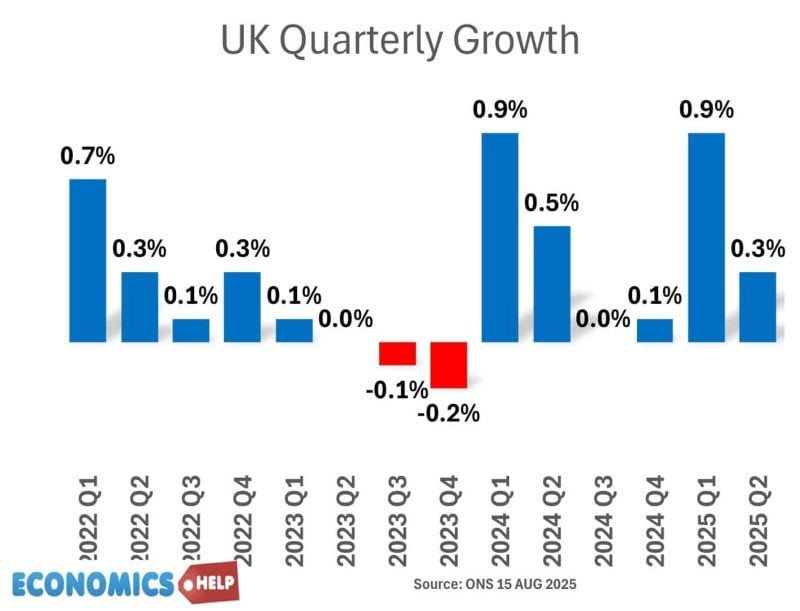
Growth is often reported as a quarterly figure. Four times a year.
It is worth bearing in mind that sometimes economic growth statistics get revised at a later stage.
Labour Productivity
Labour productivity is output per worker, this is closely related to economic growth. If labour productivity slows down it is hard to have economic growth.

Usually, the gap between actual growth and the trend rate is an indication of the output gap in an economy. But, given the length and depth of the recession, we have permanently lost some output – The ONS calculates the output gap as quite small.
UK Average disposable incomes per head

This shows the average disposable income per household. Clearly if there is lower economic growth, then this usually translates into lower household income. In fact, disposable income has been reduced more than growth, because of the rise in the tax burden.
Real household disposable income per head is an important component of GDP, but GDP is also composed of other income sources, such as profit and dividends. This shows that real household incomes per head have been stagnant since 2007.
Related
Economic Growth and Unemployment

A feature of the UK’s recovery since 2013 has been that unemployment has fallen faster than in previous recession – in the 1980s and 1990s, unemployment lagged behind the recovery. This fall in unemployment is due to several factors, such as – more flexible labour markets, low wage growth and low labour productivity. (UK Unemployment mystery)
Economic Growth and Inflation

Inflation is sometimes caused by rapid economic growth (e.g. Lawson Boom) but equally sometimes cost-push inflation (e.g. rising oil prices) can slowdown economic growth.
Further reading: is inflation caused by economic growth?
Notes on Economic Growth
- Causes of economic growth
- Costs of economic growth
- Factors affecting economic growth
- Lists of recessions
Historical Economic Growth

Volatile growth following world wars and period of recession in the 1920s and 1930s. See more at UK Economic History
Related statistics
- Unemployment
- Inflation
- UK debt
- Balance of payments
- Source ONS – IHXZ
Note on statistics
- The ONS produces statistics for chained volume measure of GDP. This is effectively real GDP
- GDP at market prices doesn’t take into account inflation.
See: ONS datasets for GDP
- UK GDP since 1955 at Guardian
About The Author

Hi there,
This has been really helpful when looking for relevant statistics at the ONS page – I wasn’t sure which dataset to chose and this was really useful. Thanks!
Hi Tejvan
Thanks for the very useful analysis.
I was wondering if you have any graphs plotting UK GDP and Unemployment against other economies which have monetary independence and their own currency.
I often see graphs comparing the US with the UK. Are there any which include Sweden, Norway, Switzerland and other countries
thanks
Jon