Forecast for Pound Sterling in 2013

A look at the future prospects for the Pound in the coming months of 2013.
sterling-index
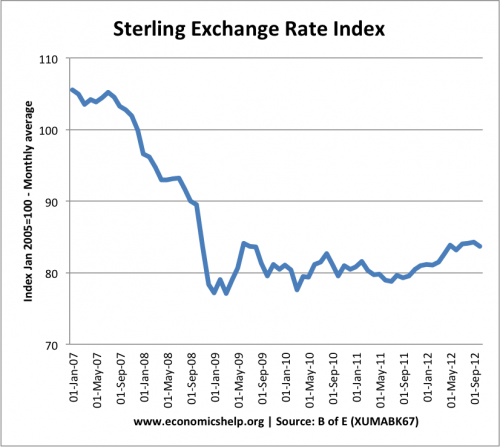
Sterling index

The Sterling index measures the value of the Pound Sterling against a basket of trade weighted currencies.

  • In  Dec 2011 the index was 80.4
  • By Oct 2011, the exchange rate index has increased to 83.6

This modest appreciation in the Pound has occurred despite:

  • Double dip recession in UK
  • UK Inflation remaining above target
  • Growing current account deficit
  • Quantitative easing increasing money supply.
  • One of largest budget deficits in OECD

Therefore the appreciation in the Pound is not so much a reflection of the strength of the UK economy – but a reflection of market nervousness about other currencies. In particulary, given the Euro crisis and difficulties of Eurozone economies, the Pound offers a greater semblance of normality and confidence.

However, given the weak state of the UK economy, it is likely that the fortunes of the Pound could deteriorate in 2013 – especially against the dollar and currencies other than the Euro.

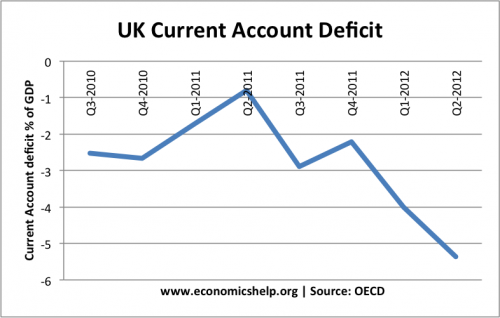
In particular, the growing UK current account deficit (now over 5% of GDP) suggests underlying lack of balance between imports and exports.
uk-current-account-quarterly-oecd

The UK has one of the largest current account deficits in the OECD. There are other reasons to explain the current account deficit, but the widening of the deficit to over 5% of GDP, suggests the Pound is becoming more uncompetitive against its main rivals. In a floating exchange rate, this is likely to lead to some depreciation in the future.

Read more

Cost of Benefit Fraud v Tax Evasion in UK

Benefit fraud and tax avoidance are currently emotive topics. What is the extent of benefit fraud and tax fraud in the UK?

Benefit Fraud

  • For 2011/12 (preliminary), it is estimated that  2.0 per cent of total benefit expenditure  was overpaid due to fraud and error.
  • In 2010/11 – benefit fraud was estimated at £3.4bn – 2.2% of total benefit expenditure (£154bn)
  •  (Dept for Work and Pensions)
  • It is also estimated that 0.9%, or £1.3bn, of total benefit expenditure was underpaid due to error.

More specifically

  • 4.4%, or £350m, of Income Support expenditure has been overpaid;
  • 6.5%, or £290m, of Jobseeker’s Allowance expenditure has been overpaid;
  • 6.0%, or £500m, of Pension Credit expenditure has been overpaid;
  • 2.4%, or £130m, of Incapacity Benefit expenditure has been overpaid;
  • 4.7%, or £1030m, of Housing Benefit expenditure has been overpaid.
  • (Dept for Work and Pensions)

Public Perception of Benefits

The public have an increasingly negative opinion to benefit claimants. A study suggested that 1 in 5 people believe a majority of claims are false, while 14% believe a majority of claims are fraudulent.  Benefits stigma

Benefits Unclaimed

“In 2010 an estimated £16 billion in benefits and tax credits were unclaimed. (charities claim £16bn a year unclaimed at Telegraph)

For example, the Dept for work and pension estimate:

Pension Credit: The number of pensioners that were estimated to be entitled but not claiming Pension Credit was between 1.21 million and 1.58 million. The total amount of Pension Credit unclaimed was between £1.94 billion and £2.80 billion.  (DWP)

Read more

Italian Economic Decline

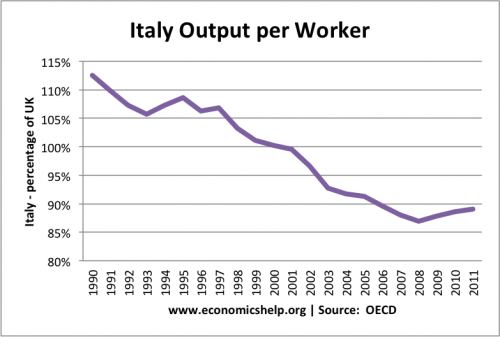
In the past 20 years, the Italian economy has stagnated compared to its main international competitors. Using different measures, such as labour productivity and relative GDP growth – Italy has fallen significantly behind. Despite low budget deficits (and primary surpluses) Italy is facing high bond yields and crippling interest payments. These high bond yields are in response to both the high levels of debt – but also the continued economic weakness.

Italian Productivity

italian productivity

Italian productivity relative to the UK. In the 1990s and 2000s, Italian output per workers has fallen behind it’s main competitors. It’s a similar story if we compare Italian productivity to France or Germany.

Read more

The Economic Cost of High Bond Yields

Readers Question I’ve recently been looking up on the Eurozone financial crisis for random reasons and i don’t understand the statement in an FT article about what we must acknowledge in order to overcome the Eurozone problems. The statement goes ‘no country can be expected to generate huge primary surpluses for long periods for the benefit of foreign creditors’. Please can you help?!

Firstly, it is not an easy article – there is a lot of jargon! To quote:

“A fundamental shift of tack is required, towards an approach focused on avoiding systemic risk, restarting growth and restoring arithmetic credibility rather than simply staving off disaster”

To answer your question:

A primary budget surplus is the government budget balance excluding the cost of interest payments on government debt.

  • Suppose the UK budget deficit is 11% of GDP.
  • But, interest payments on the government debt cost around £40bn or 3% of GDP.
  • Therefore, the primary budget deficit of the UK is 8%.
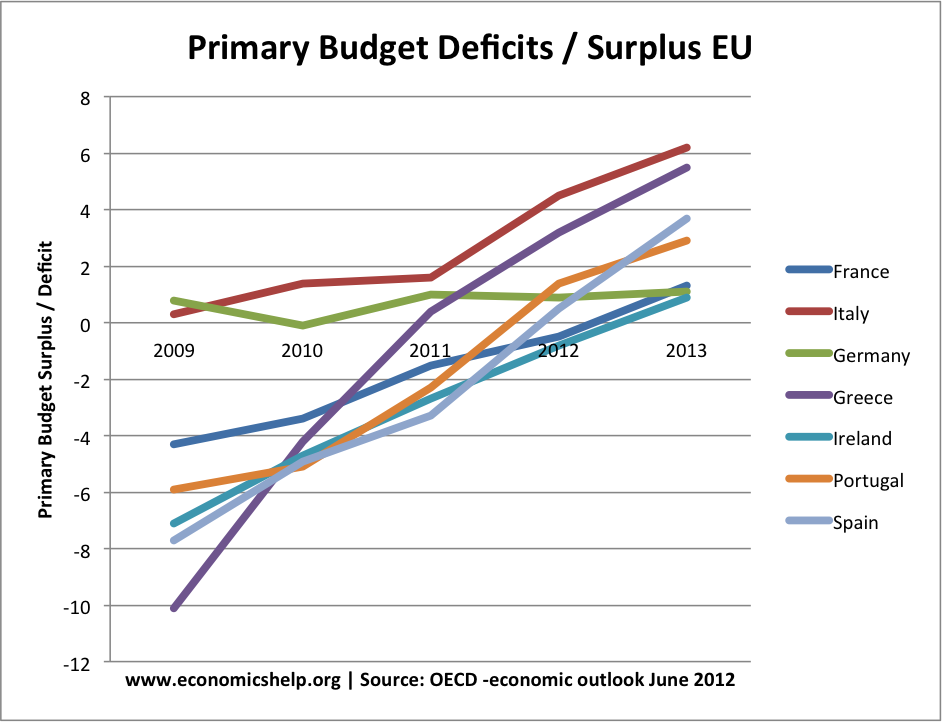
  • Suppose Italy’s budget deficit is 2% of GDP, but interest payments are 7% of GDP. In this case Italy actually has a large primary surplus of 5% (even though an actual budget deficit of 2% of GDP)
primary-budget-deficits
Source: OECD Economic Outlook June 2012

This graph showing changes in primary balances shows how countries in the Eurozone have pursued fiscal tightening (spending cuts and tax increases) to reduce their budget deficits. Excluding interest payments, many now have a primary budget surplus.

Read more

GDP at PPP compared to GDP in $US

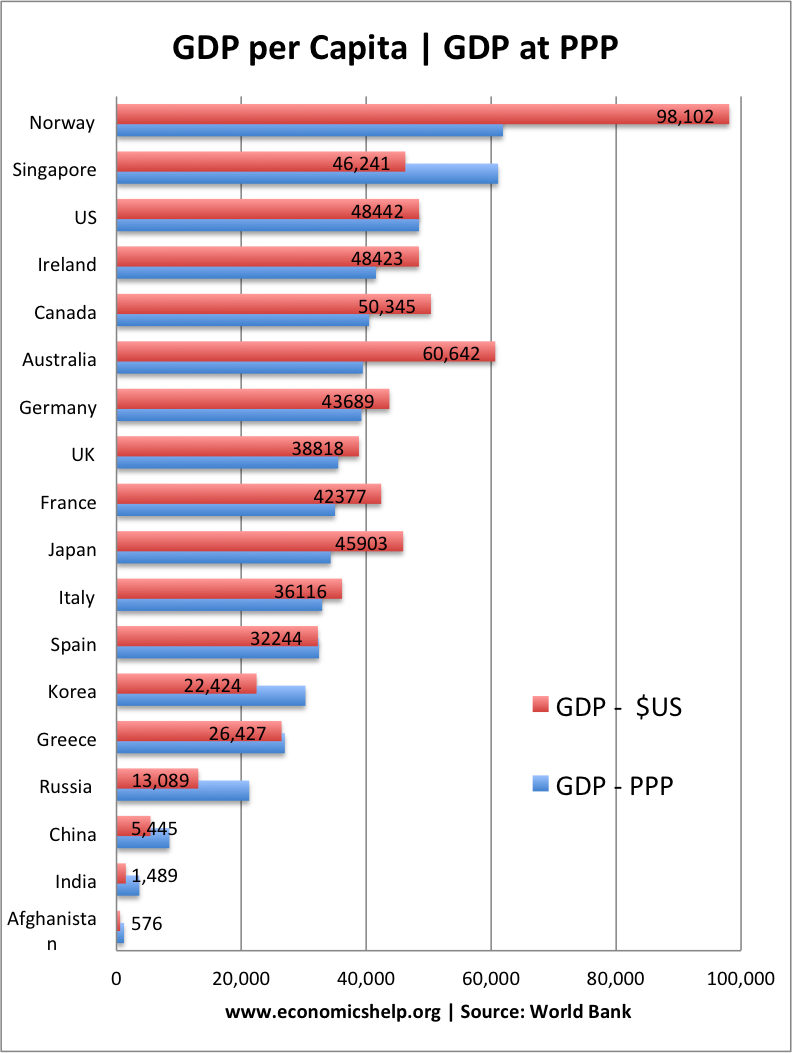
A look at how GDP per capita in $US gives different values when measured at purchasing power parity.

gdp-capita-ppp-v-gdp-us-dollars

GDP at Purchasing Power parity (PPP) takes into account variations in living costs.

PPP is an attempt to work out how much currency will be needed to buy the same quantity of goods and services in different countries. If this can be done, it can show the underlying exchange rate between the two different countries and a more accurate reflection of actual living standards in countries.

Often exchange rates don’t actually reflect different living costs because some goods are not easily traded. For example, if you live in Norway, it is irrelevant if there is cheaper accommodation elsewhere in the world. What is important is how far your income goes in buying goods and services.

Norway v India

For example, GDP per capita in Norway is $98,102. However, in Norway the cost of living is much higher (higher VAT, higher wages, higher rents). Therefore, even if you have a salary of $98,102 – it doesn’t go as far as elsewhere in the world..

By comparison, in India, GDP per capita is $1,489 per year. However, in India, living costs are much lower and so that income goes much further. If we adjust for the relative cost of living in the different countries, the gap between India and Norway is much reduced.

  • Using GDP per Capita in $US, Norway’s national income is 65 times higher than India.
  • Using GDP per Capita adjusted for PPP, Norway’s national income is only 17 times higher than India.

So we get quite a different outlook.

GDP per capita in PPP is the most useful for comparing living standards. If your income increased £400 a month, but at the same time your rent increased by £400 – would you feel any better off? No.

Read more

Financial Implosion

Readers Question: What do people mean by countries/society/financial implosion?

Financial implosion implies a serious financial crisis where a country experiences a severe economic and financial crisis. The concept of implosion suggests that a crisis in one part of the economy would have a knock on effects to other parts as well – leading to a significant decline in living standards and creating a serious of economic problems such as inflation, unemployment and rapid decline in living standards. A financial implosion could come in various forms. For example:

1. Sovereign debt crisis. If a countries government debt becomes unmanageable and the government are unable to pay back the debt, it would have to default on repayments or print money to pay back debt. If it defaulted on debt, investors would lose money and would be much more unwilling to hold onto future government bonds. If the government dealt with insolvency by printing money (e.g. Weimar Germany 1922), then it would create inflation and likely hyper-inflation. This would cause an effective default for those holding bonds.

Negative Impact of a Sovereign Debt Crisis

If a country experiences a sovereign debt crisis, it could have a serious knock-on effects for the rest of the economy.

  • Individuals and financial bodies who held bonds would see a fall in the value of their savings.
  • Hyperinflation – if the country responds by printing money. Hyperinflation would cause instability and wipe away people’s savings
  • Capital Flight. If a country is insolvent, there is likely to be capital flight away from the country. For example, foreign investors wouldn’t want to hold on to the countries bonds any more. Even domestic investors would fear losing the value of their money and make seek to save money abroad. Therefore, there could be a sharp fall in the exchange rate and a fall in living standards as imports become more expensive.
  • Austerity policies. As a consequence of a sovereign debt crisis, the government would be forced to cut government spending rapidly and or increase taxes. This would lead to unemployment and a fall in aggregate demand. Therefore, it could push the economy into recession – making the government’s budget position worse (due to falling tax revenues). To a large extent, Eurozone economies are facing this kind of deflationary debt spiral – efforts to slash budget deficits are causing a rapid fall in economic growth. In a country like Greece, there is a strong element of economic implosion – policies to deal with the crisis are only making it worse – it is hard to see a way out. (the tragedy of Greece)

    Read more

Is the French Economy at Risk?

The French are not too happy. The rating agency Moody have stripped France of their triple AAA rating – downgrading French debt to AA. [link] It probably wouldn’t be so bad, but their English neighbours still retain a AAA rating, despite having a much higher budget deficit. As the English would say, that’s just not cricket. To rub salt into the wounds, the Economist recently ran a cover with several baguettes wrapped around with a lit fuse ready to explode – The French economy on slow road to Crisis at Economist.com.

Is the French economy really at risk? or is the Economist just indulging in the traditional game of baiting the French?

Positive Signs for the French Economy

1. Bond yields.

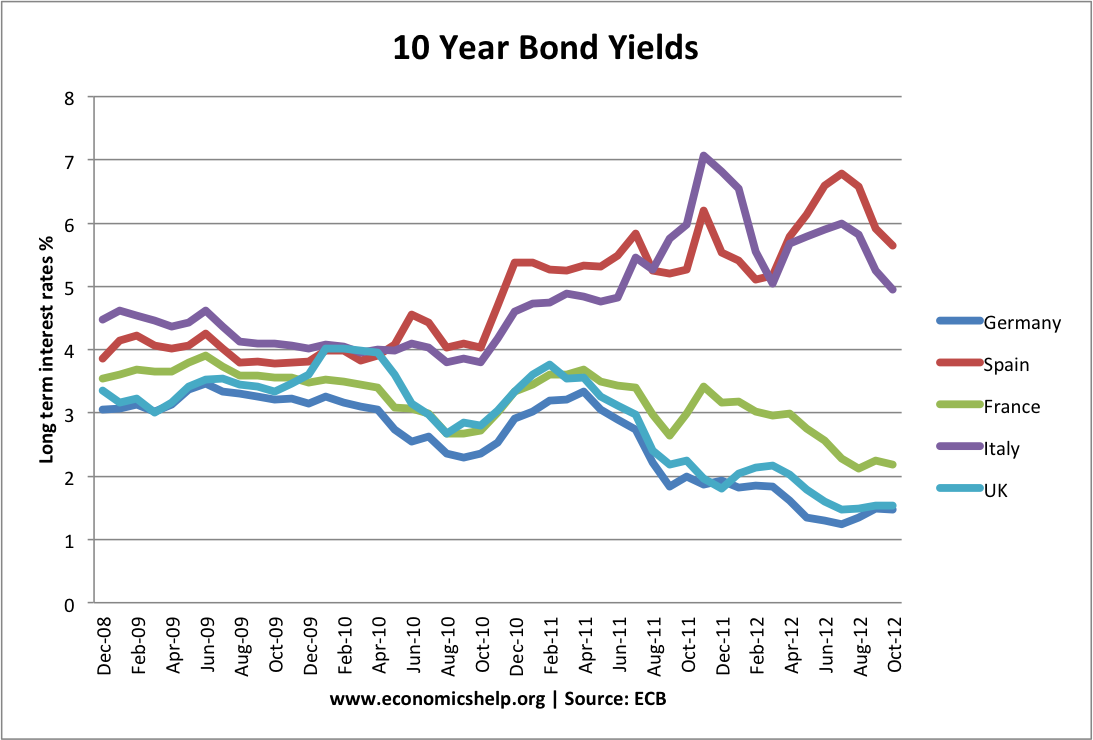
french bond yields

So far, the French have been able to weather the Euro crisis. Markets have been reassured that the French economy is strong enough to deal with the twin problems of debt levels and sluggish growth.  Furthermore, if you take the optimistic point of view, there are some signs that Eurozone bond yields have fallen from their previous peaks. The Spanish premier has recently claimed the worst of the Euro crisis is now over.

  • However, as the crisis drags on, the debt to GDP ratio show little sign of immediate improvement, The Eurozone economy is getting dragged into a recession, and  the French look more vulnerable at their exposure to other countries debt, and the growing possibility of years of economic stagnation. Optimism is a good thing, but in the context of the Eurzone, optimistic forecasts for recovery have shown a depressingly regular habit of proving to be wrong. You are hardly reassured when the Spanish Premier claims the worst of the crisis is over.
  • For France, low bond yields are good and they have enabled them to borrow at low rates, but should the economy deteriorate, the markets could quickly turn.

Read more

Falling Price of Mobile Phones

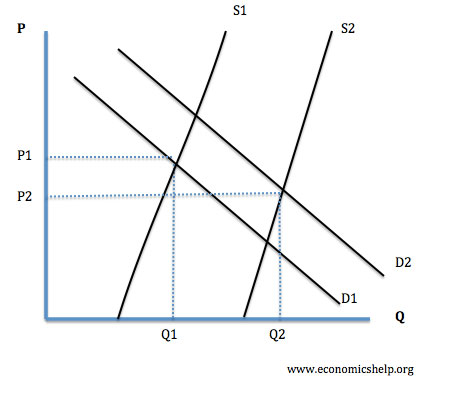
The mobile phone market is a good example of how to explain some basic concepts of supply and demand. For example, it shows how improved technology and increased supply – can reduce price, even as demand rises.

According to Evalueserve – Nokia, one of the world’s largest mobile manufacturer, recorded an approximately 39 per cent fall in its average selling price (ASP) between 2005 and 2009.

The good news for users is that over the next five or ten years, the price of mobile phones is forecast to fall. This is primarily due to the increased competition and increased supply from major producers. As markets reach saturation point, demand will increase at a slower rate. (5% a year until 2015)

Supply and Demand Diagram for Falling Mobile Phone Prices

supply-increase-demand-price-lower

This article, suggests that a key factor in reducing prices will be the growth of markets in developing economies, such as India and China. Typically, these economies have smaller disposable income, so there will be greater pressure for manufacturers to price competitively. Combined with improvements in technology, and greater competition, prices could fall up to 70 per cent (4.8 billion of active mobile phones across the globe are below USD 100 by 2015), according to a recent study.

Read more

Item added to cart.
0 items - £0.00