Paradoxes of Coalition Government

How has the coalition government fared on its economic policies? Firstly, there are quite a few paradoxes. Ignore own promises. The first paradox of the coalition government is the best thing they did was to ignore their own advice. When they came to power, they promised spending cuts, austerity and a balanced budget within a …

Read more

Government spending cuts to 35% of GDP

Firstly, I thought it might be helpful to talk about the different types of spending cuts that people refer to.

  • An actual cut in government spending. e.g. one year we spend £39bn on defence, the next year that is cut to £38 bn. This is a nominal cut of £1bn. The real cut will be even bigger.
  • A cut in real government spending. If inflation is 3% and government spending on education rises by 1%, that is a real cut of 2%. Departments will still have to cut back on wages and spending because with inflation higher than spending rises, they can afford less spending. It is fair to call this a spending cut
  • A cut in % of real GDP government-spending-percent-gdp-obr-14 Note figures for 2018-19 are a forecast. The big issues is that the Chancellor has proposed reducing the size of government spending as a % of GDP to lowest since 1948. Real government spending will rise, but as a % of national income it will be lower.

    Suppose, real GDP rises by 3%, but one department sees a rise in real spending of 1%. In this case, the department has a smaller share of national income, but at the same time has a real increase in the amount of money. This isn’t a cut in government spending, but it is cutting the share of GDP spent on that department.

  • A cut in quality of services. This is even more subjective. Suppose economic growth is 3% a year, but we increase the NHS budget by 4%. This is a real increase, and we are spending a higher % of national income on health. However, some may argue the demand for health care is rising by 8% a year due to rise in number of old people, rise in obesity e.t.c. Therefore, unless we match the demand for rising health care, it will lead to a cut in the quality of service and a rise in waiting lists. It is disingenuous to call a 4% real rise in spending a cut, but people’s experience of the NHS may feel like they are experiencing a cut.

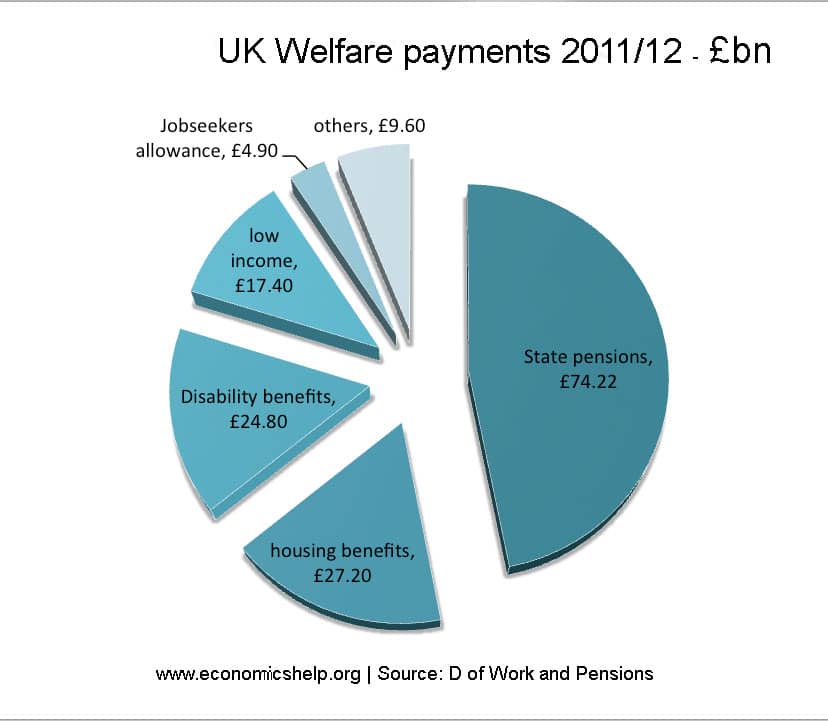
Government spending as a pie chart

UK-government-spending

Which piece of pie should be cut?

Read more

Cut in UK stamp duty

The government have announced a change in stamp duty. The chancellor George Osborne claims the change to stamp duty will cut the rate of tax for 98% of house purchases.

New marginal tax rates are:

  • 0% tax on house purchases up to the value of £125,000
  • 2% tax on purchases between £125,000 and £250,000
  • 5% tax on purchases from £250,000 up to £925,000
  • 10% tax on purchases from £925,000 to £1.5m
  • 12% tax on purchases over £1.5m

The tax change will cost the public purse £800m and represent a £4,500 cut in tax on average home of £275,000.

UK stamp duty Source: Guardian

For an average priced home of £275,000, there will be £4,500 cut in stamp duty.

Commentary

Firstly, it makes sense to get rid of the old system, where a £1 increase in house price could cause £3,000 extra tax. Marginal tax rates avoid this tax-cliff, which distorted house sales around the stamp duty rates.

It is also very progressive, with a steep increase in tax rates for more expensive houses. In some ways the new stamp duty is a weak substitute for the proposed mansion tax.

However, there are two main problems.

1. This is not a good time for tax cuts. Given the need to improve public finances, it seems strange to offer a big tax cut on stamp duty. Revenues from stamp duty have already fallen significantly since 2008 because of lower house sale volumes. This tax cut will worsen public finances. It would be better to avoid a tax cut for stamp duty and have an extra £800m to spend on infrastructure (like for example, building affordable social housing).

Some might say, ‘But, you often argue for expansionary fiscal policy, so why not support a tax cut to boost spending and support economic growth?” – Well firstly, the aim of this tax cut is not to boost economic growth. If you did want to pursue expansionary fiscal policy, you would cut VAT or income tax. Increasing income tax threshold would increase consumer spending, but I’m not convinced a cut in stamp duty would have much impact. A cut in stamp duty is not really going to encourage people to go out and spend supporting a sustained economic recovery.

With stamp duty cut we get the worst of both worlds – we get a deterioration in public finances, but it doesn’t even offer much help to the economic recovery.

Read more

Why do bus companies run empty coach services?

advertising

Readers Question: Why may it still make economic sense for the company to put on a coach for just one or two passengers, rather than turning them away?

empty-buses

Recently I again had to travel to London by coach and discovered that it was a good idea to book early in case the coach was full! Was the coach company being more sensible now?

If a bus has a capacity of 80 seats. It might need an average of say 30 customers per trip to break even.

If the company are averaging less than 30 customers per journey, their fixed and variable costs will be higher than their revenue and eventually they will go out of business.

Can it make sense to run coaches that are nearly empty?

Running a coach service early in the morning or during winter may mean the bus company can expect less than 30 passengers. From one perspective, this does not make sense. It is below the break-even point – average revenue less than average cost. It may even be a case where the marginal cost is greater than the marginal revenue from an extra service.

In fact running services at unsocial hours of the morning will be unpopular with drivers, and the company may have to pay night-time rates.

However, there can be a good long term profit maximising logic behind running these services – even if only a few passengers use them.

  • Marketing. It is a strong marketing ploy to be able to offer 24 hour, 365 days coverage. If people know you run a service all around the clock, it will give them confidence to choose coach journeys as their preferred choice of transport.
  • Attract and hold onto long term customers. Only a few people may use an unpopular service. But, the 24 hour service will encourage many to get the coach in the first place. If customers fear they may turn up and no coaches are available, they may choose other forms of transport, such as car and trains and the company loses the business of customers.
  • If you lose a customer for one journey, the company might not lose very much. But, if the customer would make 50 journeys a year, that is different. Companies have to be aware that one bad experience could make the company lose their services for a long time.
  • Barriers to entry. If an existing coach company is running a 24 hour service, it may deter a new coach company from setting up. They may feel that they couldn’t compete with this all round performance, which makes the industry less profitable. On the other hand, a new company could be sneaky and just cherry pick the busiest times of the day to offer services.
  • Costs. Running a coach service will have both fixed and variable costs. Once you have bought coaches and given drivers an annual contract, the marginal cost of extra services will be relatively low – just the petrol and maintenance. Since you have already paid for many fixed costs (drivers annual salaries, buses, marketing) the marginal cost of an extra journey may be covered by just 10 or 20 passengers. Another way to think about it the topic. Would the company want to lay off drivers for a quiet time in winter? It may lose its drivers. The company might as well keep going through quieter periods.
  • Non-profit maximising decisions. We may assume every company is a profit maximiser. But, there maybe an element within the company, that they want to provide a good, all round comprehensive bus service, and they don’t mind if a few services are loss making.
  • Market share vs Profit. Another issue is that firms often concentrate on gaining market share, rather than profit maximisation. See: Profit vs Revenue maximisation

Read more

Benefit spending in the UK

A quick look at benefit spending in the UK. This is a follow up to  Social security spending. Thanks to HM Treasury for help in finding useful data set.

Source: Public Expenditure Statistical Analysis 2014 | Data Chapter 5 – 5.2

Social Protection spending

Firstly, there has been a modification to the category of government spending, now labelled – ‘Social protection spending’ – See: Social protection spending. This is not just welfare benefits. It includes personal social services, e.g paying for nursing, care in the community; (spending which could  perhaps be better included with health care).

Secondly, by far the biggest level of social protection spending is pension spending. This includes both state pension payments and (I believe) state occupational pensions to retired public sector workers.

social-protection

It is a very unwieldy sub-division of government spending, but if we look at whole budget it increased significantly during the great recession 2009-2013. This is partly due to the cyclical higher welfare payments expected during a period of unemployment and low income growth.

However, on closer examination, by far the biggest increase in spending from the social security budget is from pensions. Pension spending increased from £83bn in 2009/10 to £104.4 bn in 2013/14. An increase of £21 bn. In a period of so called austerity, that is a big increase in government spending.

  • Unemployment benefit payments fell in this period from £5.5 bn to £4.9 bn
  • Sickness and disability benefits rose from £30.6 bn to £37.5 bn
  • Income support, tax credit (both family and social exclusion) declined from (£45.8bn) to £ 43.9 bn)
  • Housing benefit from £22bn to £26bn (see: more on Housing benefit)

UK Pension spending

pension-spending-uk

Read more

Mansion tax – pros and cons

Wealth inequality UK

A mansion tax (or property tax) would be an annual progressive charged that would be paid by homeowners. It is effectively a tax on housing wealth. The Labour party has suggested implementing a property tax on homes worth over £2 million. Exact details have not been confirmed, but the suggestion is that it will be a progressive tax meaning the greater the value of the homes, the more the annual tax will be.

In 2010, the Lib Dems proposed a mansion tax based on 1% of a property’s value above £2m. This threshold would also rise in line with increasing house prices. In this case a property worth £2.5 million would pay an annual tax of £5,000 a year.

Proponents of the tax argue that it will help raise revenue, cool a booming property market and help to redistribute the great increase in wealth inequality that we have seen within the UK.

Critics argue that it could lead to people who are property rich, but income poor, struggling to pay the annual charge.

Benefits of a Mansion Tax

In recent decades, the UK has seen a dramatic increase in wealth inequality. House prices have risen above the rate of inflation making many homeowners much better off. But, those who cannot get on the property ladder are struggling with very high rents and an inability to get on the property ladder.

Wealth inequality UK Source: Wealth and Assets Survey – Office for National Statistics

A report by the ONS shows that there is considerable wealth inequality within the UK.

Read more

UK Social security budget

A look at how much the UK government spend on social security, benefits and welfare payments.

Note. I found it very difficult to find stats on how much the government spends on various benefits. The most helpful places were.

Headline stats

Total public spending 2013/14 – £686 billion.

  • Social security budget- £251 billion 37% of 2013/14 spending
  • State pensions account for £83 billion
  • Welfare spending of £168 billion or roughly 25% of budget
  • Benefit spending – of the £205 billion or so spent on tax credits and social security benefits, the IFS calculate about £111 billion is spent on those over pension age and £94 billion on those of working age.
  • Source: welfare spending at IFS

Benefit spending in the UK

The only breakdown I could find of benefit spending was from this Guardian data doc. Using original data from the Department of Work and Pensions .


Welfare benefits (billion, bn)

  • Housing benefit    £16.94
  • Disability allowance    £12.57
  • pensions credit +MIG    £8.11
  • iIncome support    £6.92
  • Rent rebates    £5.45
  • Attendance allpwance    £5.30
  • Incapacity    £5.30
  • Jobseekers allowance    £4.90 (0.7% of total spending)
  • Council tax benefit    £4.80
  • employment + Support    £3.58
  • sick + maternity pay    £2.55
  • Social fund    £2.37
  • carers allowance    £1.73
  • financial assistance    £1.24
  • Total £159


uk-welfare-payments

Main groups of welfare payments

  • State pensions    £74.22
  • housing benefits    £27.20
  • Disability benefits    £24.80
  • low income    £17.40
  • Jobseekers allowance    £4.90
  • others    £9.60
  • total    £159

Where:

  • housing = housing benefit + rent rebate + Council tax benefits
  • disability = disability allowance, incapacity benefit, carers allowance
  • low income support – pensions credit, minimum income guarantee, social fund

Read more

Housing benefit in the UK

housing-benefits-number

Readers Question: There are around 22 million households in the UK, 2/3 of whom own their house.
So the rental market would be around 7 million of whom one million receive benefit, some portion living in social housing, some in private rented housing. Does that seem reasonable? Can you point me towards actual numbers?

In August 2014, 4.93 million received housing benefit, at an average weekly payout of £93. This gives a rough annual cost of £23 billion. Dept Work and Pensions

What is housing benefit?

Housing benefit is a means tested benefit paid to the unemployed and low paid to help with the cost of rent. For a family living in a large four bedroom house – housing benefit can be up to £400 a week. (Housing Benefit.gov.uk)

The aim of housing benefit is to help those on low income afford their housing costs.

  • It is particularly important for areas of high housing costs, such as London. Without housing benefit, there would likely be a shortage of workers because people would have to move away to cheaper areas.
  • Housing benefit helps to reduce inequality and relative poverty by helping people with their major living costs.
  • Housing benefit can help avoid homelessness by giving people help with housing costs.
  • Housing benefit can be claimed with other benefits, such as unemployment benefit and tax credits.

Whether you are eligible and the amount you get is determined by a local authority housing allowances (LHL)

Number claiming housing benefit

housing-benefits-number

Housing Benefit case load statistics Dept Work and Pensions

Source: Single Housing Benefit Extract (SHBE), via Stat-Xplore

Of this 4.93 million

  • 1.28 million are over 65.
  • 468,000 are receiving job seekers allowance
  • 3.3 million are in the social rented sector. 1.6 million are in the private rented sector
  • The biggest area for receiving benefits was London with 835,000.

The great recession of 2008-2014 saw a marked rise in the numbers eligible for housing benefit. The numbers claiming housing benefit peaked at just over 5 million in early 2014. In Aug 2014, 4.93 million received housing benefit.

The rise in numbers claiming housing benefit is due to factors such as:

  • Fall in real wages causing more people to be eligible for income related means tested benefits.
  • Rise in unemployment during the great recession, which significantly reduces income.
  • Rise in cost of renting during this period.

Read more

Item added to cart.
0 items - £0.00