Food Poverty in UK

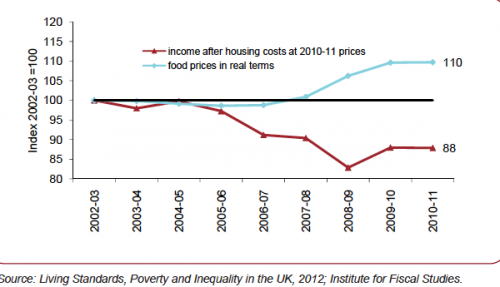
The past few years have seen a rapid rise in real food prices – especially, fruit, vegetables and meat. At the same time, we have seen falling real incomes for low-income decile groups. The consequence is that those on low incomes have been changing their diet in response to higher prices. With squeezed real incomes, there has been a greater preference for ‘cheap calories’ and lower demand for ‘more expensive calories’ – such as fruit and vegetables. Some fear the poorest are struggling to buy sufficient food.

The consequence of a switch to ‘cheap calories’ (e.g. saturated fats, processed sugar, less fruit and veg) has been to contribute to concerns about the nation’s health. During this period, obesity has continued to increase.

Price is not the only factor to influence the demand for food. But, increasingly, consumers are mentioning food prices and promotions as key factors in determining choice.

Income Decline for low-income groups
food poverty


Median income after housing costs fell 12% between 2002-03 and 2010-11 for low-income decile households – while rising in all other income groups.

Food prices have risen 12% in real terms over the last five years taking us back to 1997 in terms of cost of food relative to other goods.

Read more

Is 24 hour, 365 day a week shopping a sign of progress?

Recently a reader asked whether economic growth was increasing living standards and why economic growth was not leading to more leisure time in developed economies. – Is economic growth necessary?

Not only is leisure time not increasing, but it is becoming more common for ‘special holidays’ to become just another retail day.

In the US, stores used to be closed for the whole of Thanksgiving – an important national holiday. Traditionally a time for families to spend time together. However, the day after Thanksgiving is such a retail bonanza that shops are moving opening times earlier and earlier. Now, big stores like Walmart, Gap  and Target are opening on Thanksgiving – hoping to benefit from the earliest rush of consumer spending. From a business perspective, it makes sense to capitalise on this boom in retail sales. Shops which stay closed on Thanksgiving missed out on this surge in retail sales. But, the extra time for shopping  comes at the cost of workers being pressured to work on national holidays and miss an important chance to spend time with their families.

Companies may point to the fact that some workers don’t mind working on national holidays, and are grateful for the opportunity to earn overtime. However, labour unions argue this ignores the reality that most workers would like to spend time with their family, but feel no alternative but to work.

Read more

Triple-dip Recession Could Lead to Lower Credit Rating

Recently, a report suggested austerity can increase debt levels. Now, there is an indication that austerity could cause a decline in credit ratings. This has certainly been the experience of many European countries – who since they introduced austerity measures – have seen a reduction in their credit rating. Austerity hawks have often sold immediate …

Read more

Impact of tax avoidance by Amazon

Directors of big multinationals such as Amazon, Google and Starbucks received a challenging investigation by MPs annoyed that big multinationals are avoiding paying corporation tax. An Amazon director was described as being ‘deliberately evasive’ and being unacceptably ignorant of who owned the Luxembourg based Amazon company – used to avoid UK tax. According to Conservative …

Read more

Have the Government misled the public on UK debt?

Readers Question: The government keeps claiming that their harsh (but very necessary) austerity policies are working and that they have reduced the national debt by 24%, yet your graphs seem to totally disprove this claim. If anything, your graphs seem to show that the national debt is continuing to rise quite steeply, despite the government’s austerity policies, primarily because tax revenues are down and welfare payments are up because of the rising unemployment across the country (caused as far as I can see by the government’s austerity policies). Is the government painting a misleadingly and unfounded rosy picture to prove their policies are working, or am I failing to read your graphs correctly?

deficit

The government is correct to say that the budget deficit (Annual borrowing) has fallen by 25% since the peak of 2009-10.

debt

This means the national debt (total amount government owe) has increased at a slower rate than it might have done. But, it is still increasing rapidly.

Read more

Global Health Care Costs

A look at the contradiction between health care spending and actual treatment. The US which spends more on private sector health care spending, still also has one of the highest levels of government spending on health care per capita. Furthermore, health care costs continue to rise, and place one of the greatest strains on government spending commitments in the developed world.

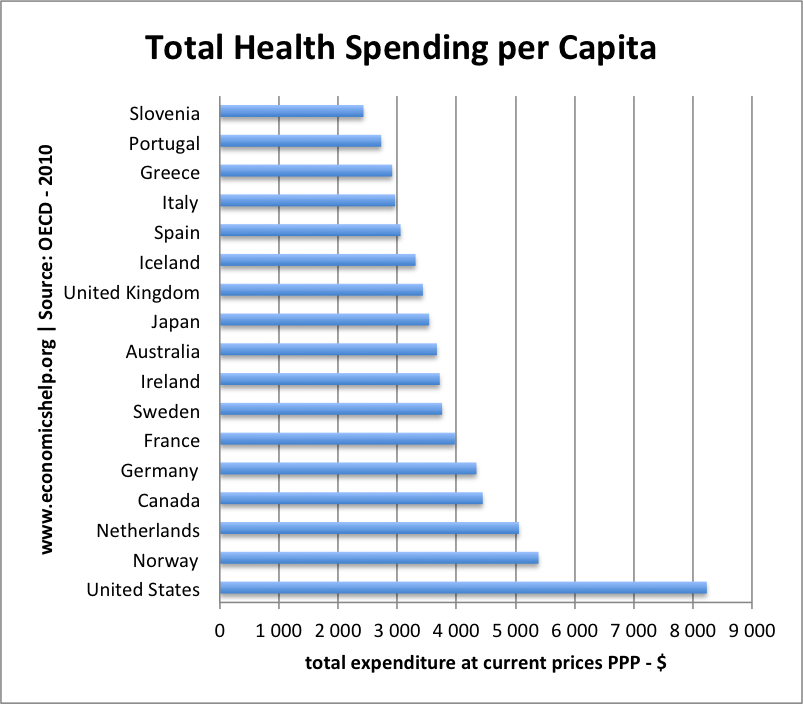
total health care spending - list of countries

This graph shows total health care expenditure (including both public and private spending). The biggest spender by a long way is the US, which spends over $8,000 per capita. This compares to less than $3,000 per capita for Italy, Greece and Portugal.

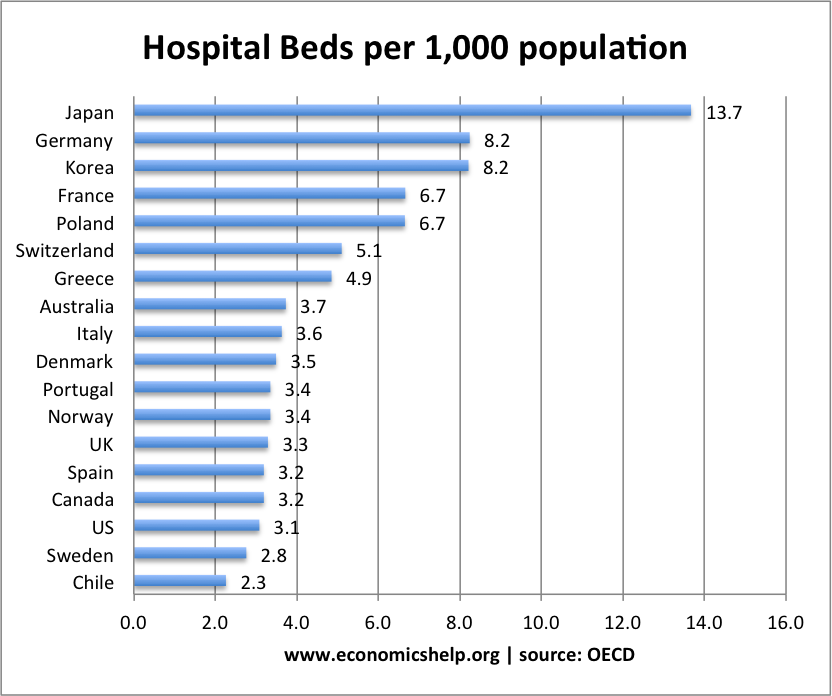
Hospital Beds per 1,000 Population density

hospital-beds

Admittedly, the number of hospital beds per 1,000 of the population is not a comprehensive guide to the quality of health care. But, it is still interesting that the US has one of the lowest numbers of hospital beds per 1,000 (3.1) – despite the much higher total spending. Japan has the highest number of hospital beds at 13.7/1000 – yet quite a modest total health care bill.

On other measures, US seems to get poor performance from its spending.

% of health care spending as % of GDPGovt spending as % of total health carePer Capita expenditure 2006 (PPP)Doctors per 10,000 populationNurses / midwives per 10,000Hospital beds per 10,000Life Expectancymale obesity
UK8.287.3281523128398022%
US15.345.367192694317831%

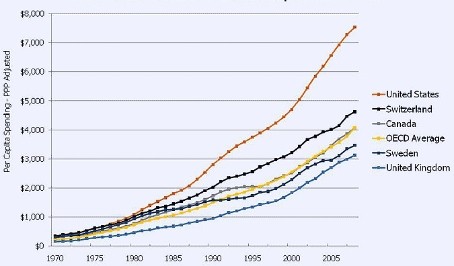
US v UK health care costs)

Rising Health Care Costs

source: KFF

Read more

UK Construction Sector Growth Stats 2012

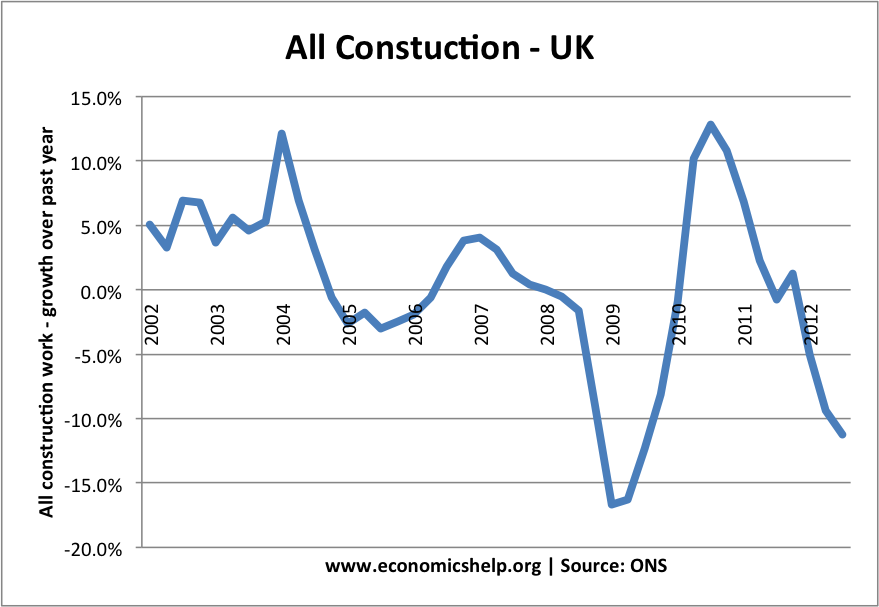
The UK construction sector remains largely depressed with construction volumes still below pre-recession levels.

In headline figures produced by the ONS, the estimated level of the total volume of construction output in the third quarter of 2012 was the lowest since the second quarter of 1999.

The construction sector is one of the most volatile sectors in the economy, and can be seen as a barometer for the wider economy and economic performance. Although there are signs of some recovery in infrastructure investment, the current outlook looks pessimistic for future economic recovery.

UK construction sector

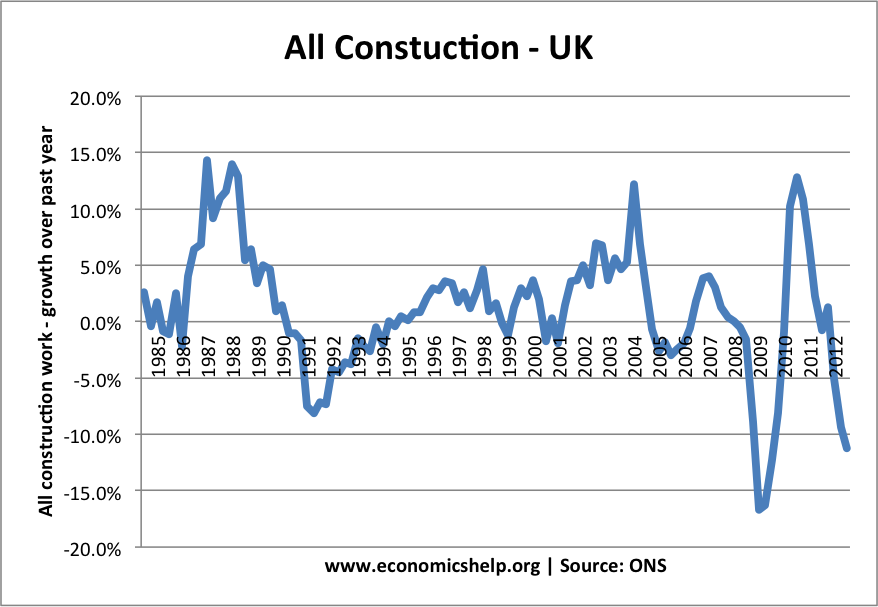
The annual growth of construction volumes mirrors the double dip recession. (economic growth)

The fall in construction during the 2008/09 recession was greater than the previous recession during 1991. Note the boom in construction during the late 1980s was much greater than the limited growth between 2005-08.

UK construction

Recently, the biggest falls have been in the private industrial and private commercial sectors of construction.

Read more

Could US Make Same Mistakes as Europe?

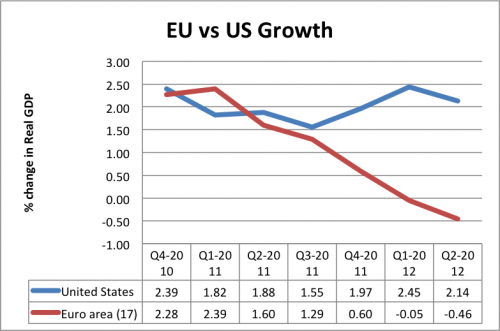
In 2009, US and EU unemployment rates both stood at 10% – but since then EU unemployment has increased to 12% and US unemployment fallen to 7.9%. (see: US v EU unemployment)

These contrasting fortunes in unemployment are a reflection of diverging rates of economic growth. Whilst, Europe has entered a double dip recession, the US has experienced a sustained economic recovery. It is also a reflection of different economic policy – the EU has become obsessed with reducing budget deficits, the US has given more focus to promoting economic recovery.

recession

However, in the face of concerns over levels of US government borrowing and impending debt ceilings, many in the US are pushing for a rapid fiscal consolidation.

But is US austerity necessary? and what will be the impact of austerity on a) the budget deficit and b) economic growth c) long-term structural spending and debt commitments?

Is Austerity Necessary in US?

total us debt

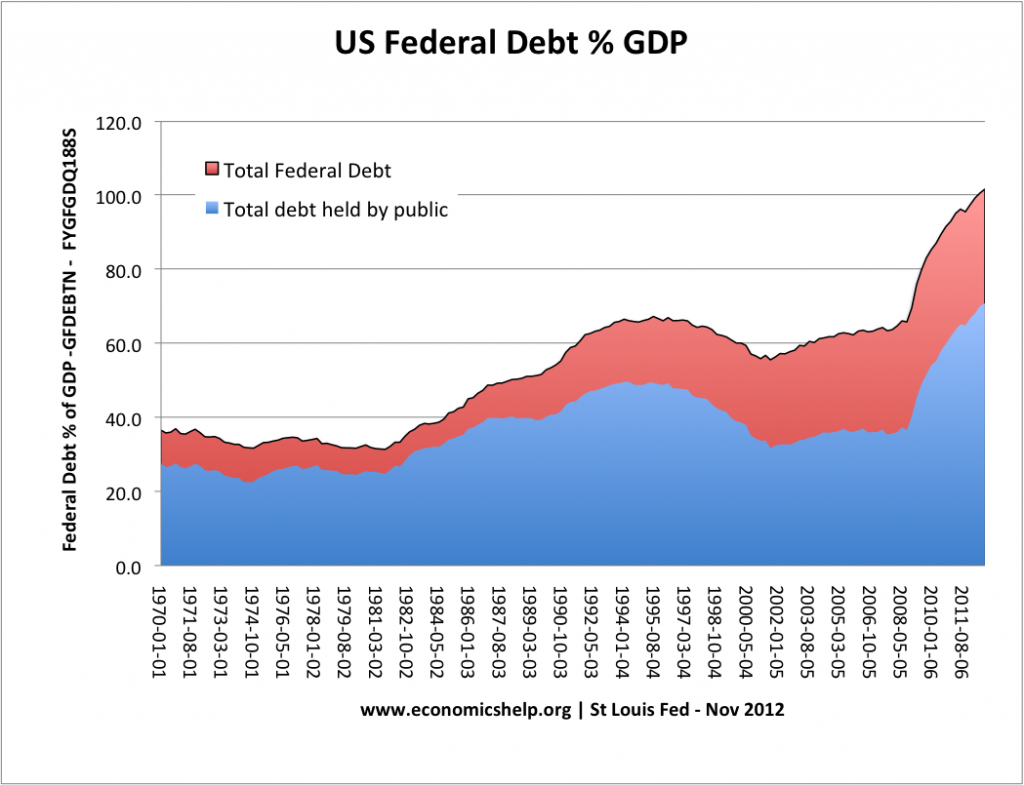
Total Federal Debt increased to 101% of GDP in Q2 2012. It is a sharp increase since 2008, when debt was just over 60% of GDP. But, this is to be expected in a recession as deep as past recession.

Read more

Item added to cart.
0 items - £0.00