What is the UK’s debt burden?
Firstly, there are different types of debt to consider
- Government debt – See: public sector debt (often referred to as National debt)
- Private sector debt – indebtedness of householders, finance sector and non-financial companies.
- External debt – the amount we ‘owe’ to other countries
In addition, you might take into account – future liabilities, e.g. pension fund commitments. Also, equally important, is future economic growth, tax revenue and the ability to meet the current debt burden.
Debt burden as % of income
The most useful way to consider the debt burden. Is to consider:
- Debt as a % of income.
- Also, the % of income / taxes spent on debt interest payments
Government debt

UK government borrowing fell to record levels in the early 1990s, but since the financial crisis, national debt as a % of GDP has increased to 78% of GDP (2015).
A related to concept to total national debt is the budget deficit. The budget deficit is the annual amount the government is borrowing.
Debt interest payments as % of GDP
Another important consideration is how significant are debt interest payments.
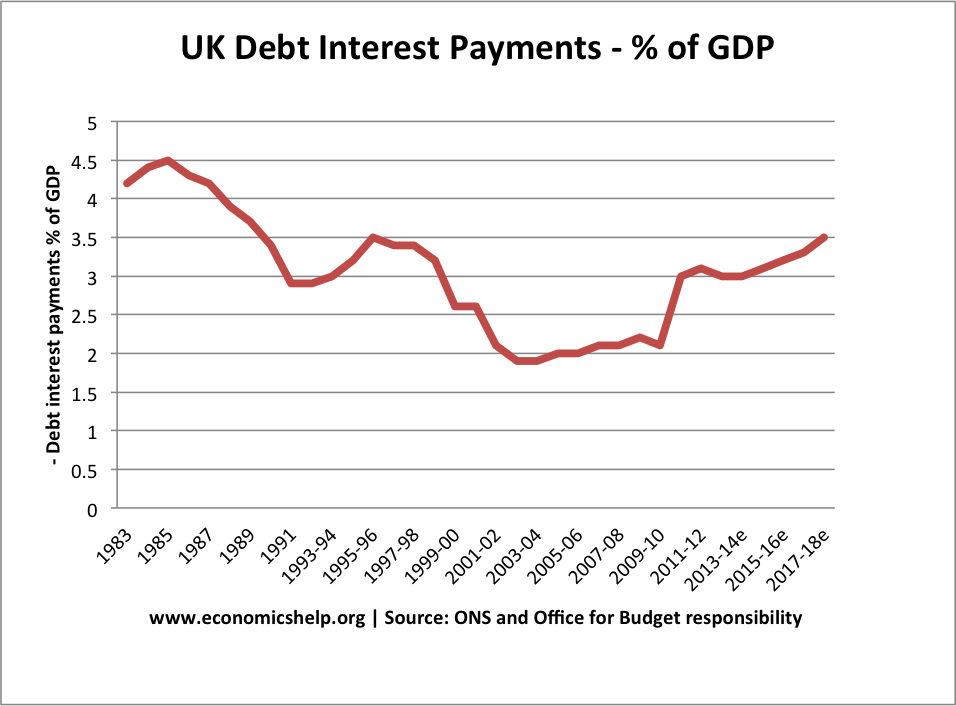
With low interest rates, the cost of servicing the UK government debt is lower than we might expect. Many economists suggest that when interest rates are low, the government should take advantage and borrow to finance investment.
See also: UK Debt interest payments
The amount spent on debt interest payments is important for understanding the ‘debt burden’ If you take out a mortgage, the crucial thing is not the total amount outstanding, but the percentage of your income that is spent on mortgage monthly payments.
Who is the UK debt burden owed to?
Another important consideration is who does the UK government borrow from?
The majority of UK public sector debt is owned by the UK private sector / Bank of England.
Private sector debt
In addition to government debt it is also important to look at private sector debt. In particular household debt / company debt. For example, at the start of the recession, household debt fell because householders sought to increase savings and pay off their debts, due to low confidence. In this case the government borrowing is partly offsetting the rise in private sector saving.
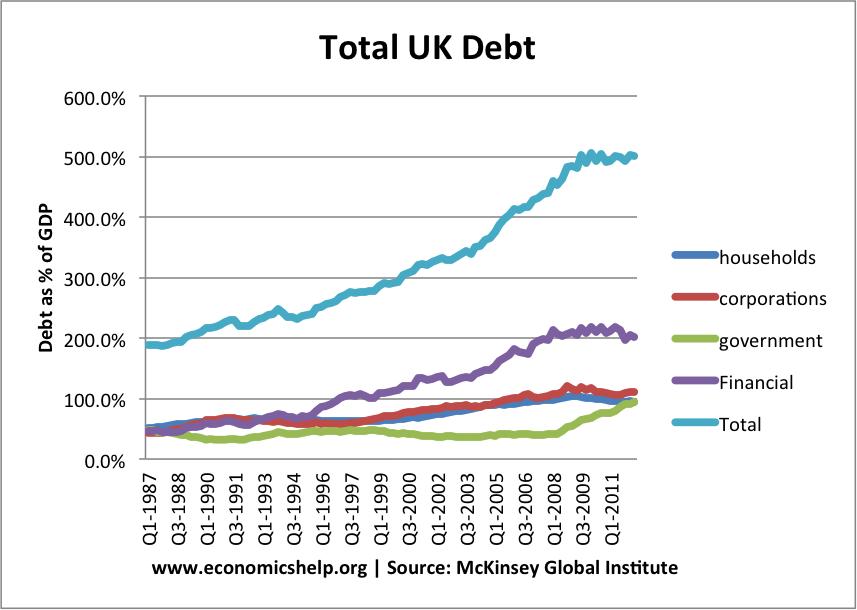
Financial debt is more complicated. The UK tends to have a large share of financial debt as a % of GDP because it has a large finance sector. But, these large liabilities are offset by high financial sector assets. Financial sector debt becomes a problem if assets fall in value. (e.g. during credit crunch)


