UK 2024 Recession – Is it Avoidable?

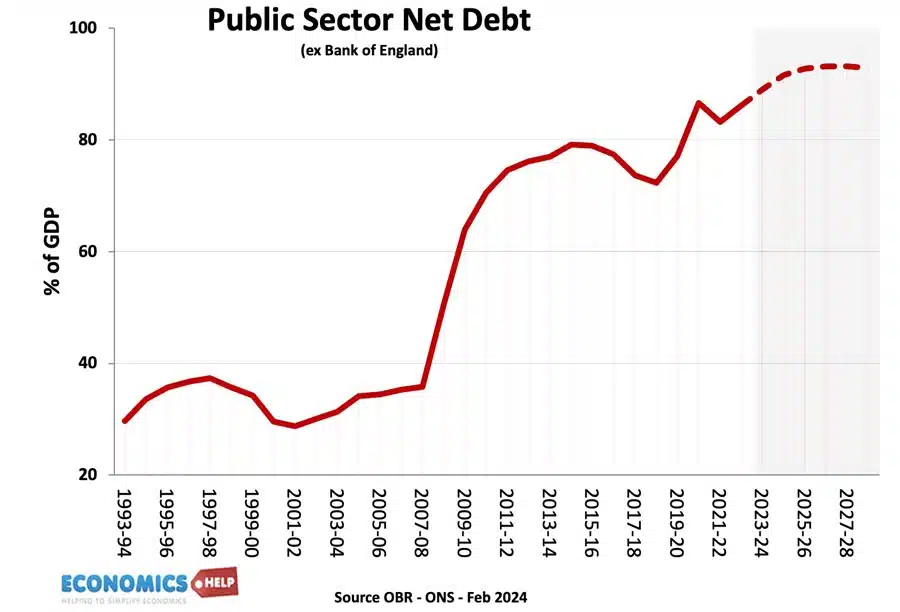
Last week the UK economy slipped into recession. But, was it avoidable? Why are interest rates not coming down when households are facing the greatest squeeze on incomes for a generation? Although inflation is falling it is still above the inflation target, but it is a mistake to prolong a recession, when inflation is expected …