Triple-dip Recession Could Lead to Lower Credit Rating

Recently, a report suggested austerity can increase debt levels. Now, there is an indication that austerity could cause a decline in credit ratings. This has certainly been the experience of many European countries – who since they introduced austerity measures – have seen a reduction in their credit rating. Austerity hawks have often sold immediate …

Read more

Impact of tax avoidance by Amazon

Directors of big multinationals such as Amazon, Google and Starbucks received a challenging investigation by MPs annoyed that big multinationals are avoiding paying corporation tax. An Amazon director was described as being ‘deliberately evasive’ and being unacceptably ignorant of who owned the Luxembourg based Amazon company – used to avoid UK tax. According to Conservative …

Read more

Have the Government misled the public on UK debt?

Readers Question: The government keeps claiming that their harsh (but very necessary) austerity policies are working and that they have reduced the national debt by 24%, yet your graphs seem to totally disprove this claim. If anything, your graphs seem to show that the national debt is continuing to rise quite steeply, despite the government’s austerity policies, primarily because tax revenues are down and welfare payments are up because of the rising unemployment across the country (caused as far as I can see by the government’s austerity policies). Is the government painting a misleadingly and unfounded rosy picture to prove their policies are working, or am I failing to read your graphs correctly?

deficit

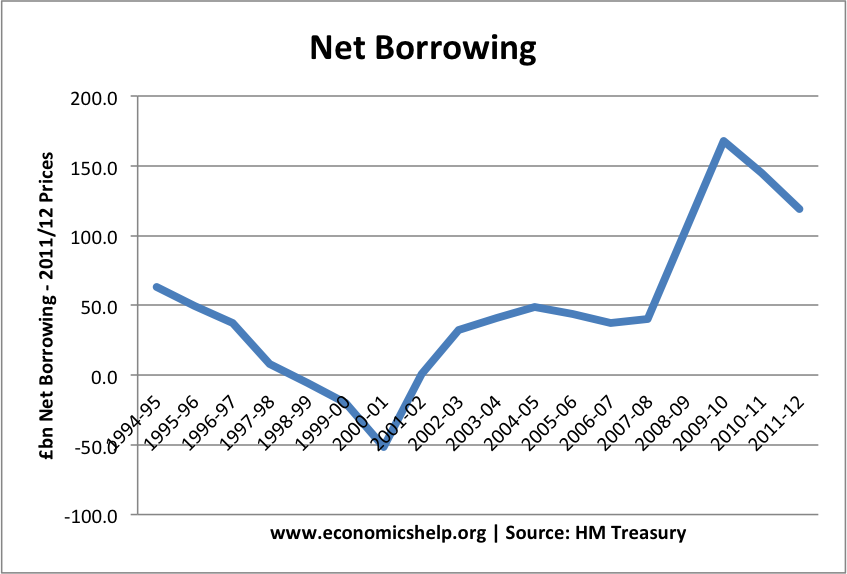
The government is correct to say that the budget deficit (Annual borrowing) has fallen by 25% since the peak of 2009-10.

debt

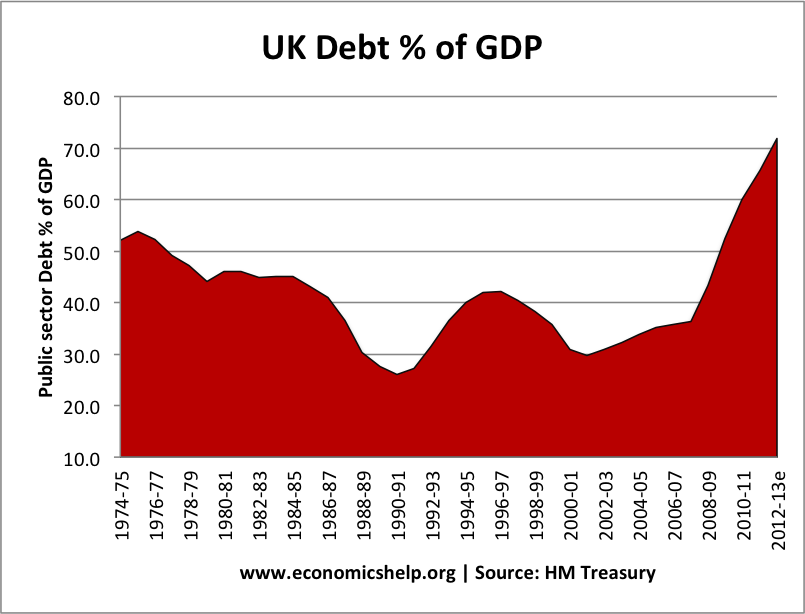
This means the national debt (total amount government owe) has increased at a slower rate than it might have done. But, it is still increasing rapidly.

Read more

Global Health Care Costs

A look at the contradiction between health care spending and actual treatment. The US which spends more on private sector health care spending, still also has one of the highest levels of government spending on health care per capita. Furthermore, health care costs continue to rise, and place one of the greatest strains on government spending commitments in the developed world.

total health care spending - list of countries

This graph shows total health care expenditure (including both public and private spending). The biggest spender by a long way is the US, which spends over $8,000 per capita. This compares to less than $3,000 per capita for Italy, Greece and Portugal.

Hospital Beds per 1,000 Population density

hospital-beds

Admittedly, the number of hospital beds per 1,000 of the population is not a comprehensive guide to the quality of health care. But, it is still interesting that the US has one of the lowest numbers of hospital beds per 1,000 (3.1) – despite the much higher total spending. Japan has the highest number of hospital beds at 13.7/1000 – yet quite a modest total health care bill.

On other measures, US seems to get poor performance from its spending.

% of health care spending as % of GDPGovt spending as % of total health carePer Capita expenditure 2006 (PPP)Doctors per 10,000 populationNurses / midwives per 10,000Hospital beds per 10,000Life Expectancymale obesity
UK8.287.3281523128398022%
US15.345.367192694317831%

US v UK health care costs)

Rising Health Care Costs

source: KFF

Read more

UK Construction Sector Growth Stats 2012

The UK construction sector remains largely depressed with construction volumes still below pre-recession levels.

In headline figures produced by the ONS, the estimated level of the total volume of construction output in the third quarter of 2012 was the lowest since the second quarter of 1999.

The construction sector is one of the most volatile sectors in the economy, and can be seen as a barometer for the wider economy and economic performance. Although there are signs of some recovery in infrastructure investment, the current outlook looks pessimistic for future economic recovery.

UK construction sector

The annual growth of construction volumes mirrors the double dip recession. (economic growth)

The fall in construction during the 2008/09 recession was greater than the previous recession during 1991. Note the boom in construction during the late 1980s was much greater than the limited growth between 2005-08.

UK construction

Recently, the biggest falls have been in the private industrial and private commercial sectors of construction.

Read more

Could US Make Same Mistakes as Europe?

In 2009, US and EU unemployment rates both stood at 10% – but since then EU unemployment has increased to 12% and US unemployment fallen to 7.9%. (see: US v EU unemployment)

These contrasting fortunes in unemployment are a reflection of diverging rates of economic growth. Whilst, Europe has entered a double dip recession, the US has experienced a sustained economic recovery. It is also a reflection of different economic policy – the EU has become obsessed with reducing budget deficits, the US has given more focus to promoting economic recovery.

recession

However, in the face of concerns over levels of US government borrowing and impending debt ceilings, many in the US are pushing for a rapid fiscal consolidation.

But is US austerity necessary? and what will be the impact of austerity on a) the budget deficit and b) economic growth c) long-term structural spending and debt commitments?

Is Austerity Necessary in US?

total us debt

Total Federal Debt increased to 101% of GDP in Q2 2012. It is a sharp increase since 2008, when debt was just over 60% of GDP. But, this is to be expected in a recession as deep as past recession.

Read more

Broadband Statistics in UK and Rest of World

broadband statistics
Source: OFCOM

Broadband access in the UK. Also showing different access points to broadband.

In the space of less than 10 years, Broadband access has come to be seen as a vital public amenity. It is used for business, retail and is increasingly seen as one of the factors which can show the degree of economic development in an economy.

Also, in a fast moving market, there has been a strong growth of mobile broadband, as people increasingly check the internet from their own smart phones. With 20% of UK households still not receiving broadband, the government has announced policy measures to support the rolling out of broadband in rural areas.

Read more

Why Do People Not Notice Economic Growth?

Readers Question: why does economic growth not get noticed by the man on the street?

  • Recently, the ONS released a report saying that real wages were 62% higher than in 1986. This is the result of sustained economic growth. (Real wages take into account inflation.)
  • In April 2011 the average full-time employee in the UK earned around £12.62 per hour excluding overtime.
  • This is a monetary (nominal) increase of 226% since 1986 when the average wage was £3.87 per hour.

Inequality of Real Income growth

  • The top 1 per cent had the biggest increase between 1986 and 2011, at 117%
  • The top 10 per cent saw an increase of 81%
  • The bottom 10 per cent had a 47 % increase.
  • The very poorest did better, with the lowest 1 per cent having a 70% increase.


However, in the period 2007-11, all income groups have seen a fall in real wages as nominal wage growth has failed to keep up with inflation.

real GDP

If we asked people do they feel better off than 1986, it is hard to know what people would say. I’m sure some would feel better off, but many may reply they don’t. Why don’t people notice economic growth? Some possible reasons:

  • Economic Growth and living standards. Economic growth measures the increase in real GDP (real output, real incomes). However, GDP  is often a poor reflection of living standards and peoples sense of well being. For example, despite rising real incomes, people may not feel as well off. This could be because:
    • Quality of life diminished by pollution or increased congestion
    • Increased fear of crime that may occur with economic growth. (Ironically, with more income, people have more to lose. Crime rates are higher in the UK, than in the 1930s – a period of greater poverty)
    • see also: difficulty in measuring living standards

      Read more

Item added to cart.
0 items - £0.00