Does the UK have a housing bubble?

Readers Question: Do you think the help to buy scheme is fuelling a housing bubble? Only about 3% of houses are bought through this method but do you think that it is likely that a bubble will develop?

In a way, I think you answer the question yourself in stating that only 3% of houses are bought through this method

With such a small percentage of homes bought through this scheme, it is not going to be a major cause of a housing bubble; however, in a relatively significant way, it will add to housing demand. Given the inelastic nature of housing supply, it will make a contribution to pushing up house prices.

Without the help to buy scheme would people have bought houses anyway? I’m not sure. I think the scheme will definitely help some to get a mortgage, and therefore buy rather than renting. In that regard it is adding to housing demand, and therefore pushing up prices, but only a small amount.

Will a housing bubble develop?

This is a more difficult question. There are different types of housing bubbles.

One is the housing bubble experienced by US, Ireland and Spain – where property prices rose substantially above average earnings, and then fell by up to 50%. This is because house prices in these countries became divorced from the fundamentals of housing supply and demand. When the mortgage market experienced difficulties, demand fell and prices fell significantly. The crucial thing about US, Ireland and Spain was that after the housing bubble and bust, there was a large excess supply of housing. Therefore, when demand fell, prices fell considerably.

uk-irish-house-prices

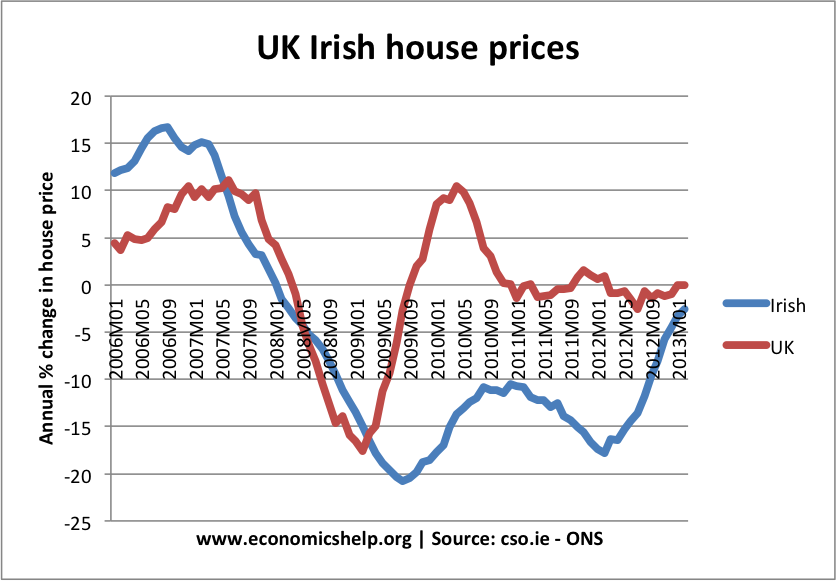
See: Ireland Housing bubble and bust

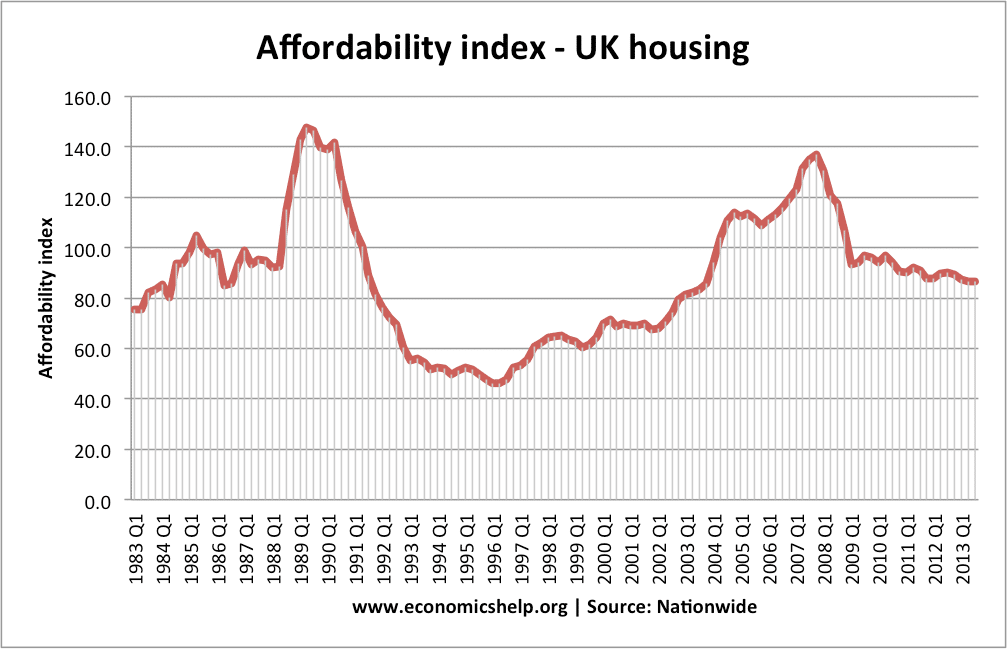
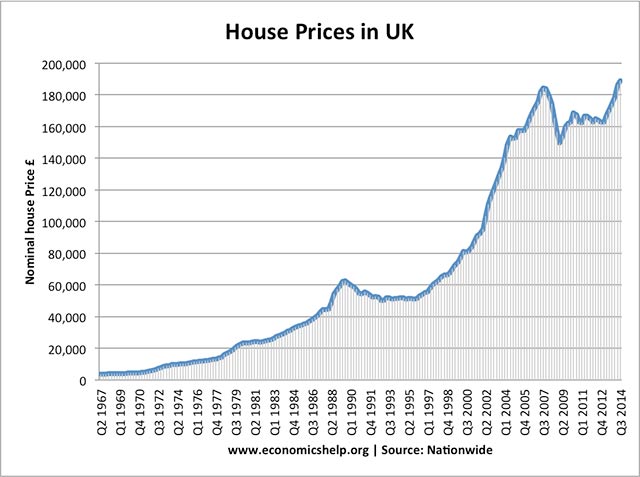
The UK housing market behaved differently. When demand fell in 2007/08 because of the credit crunch, prices did drop by 20%. But, house prices stabilised much quicker, and then – defying many predictions – began to rise quite rapidly. Meaning that in the UK, house prices in many areas are higher than before the crash.

The main difference is that in the UK, there was no excess supply of housing; there was no boom in home building. Therefore, when the crash came, there was still this fundamental shortage of housing, which keeps prices ‘artificially’ high.

Why UK property prices may be overpriced

uk-house-prices-2001-2013q2

  • Interest rates set to rise. UK interest rates have stayed at zero since early 2009; this period of ultra low interest rates has benefited the property market and kept mortgages affordable. If interest rates rise back to ‘normal’ rates (e.g. around 5% – many homeowners will see a sharp rise in the cost of mortgages, causing demand to fall. The Bank of England recently did a survey and found a two-percentage-point rise in mortgage interest rates would likely raise the proportion of mortgagors with a debt service ratio (DSR) of at least 40% from its current level of 4% to about 6% (360,000 to 480,000 households)

    nw-affordability-index
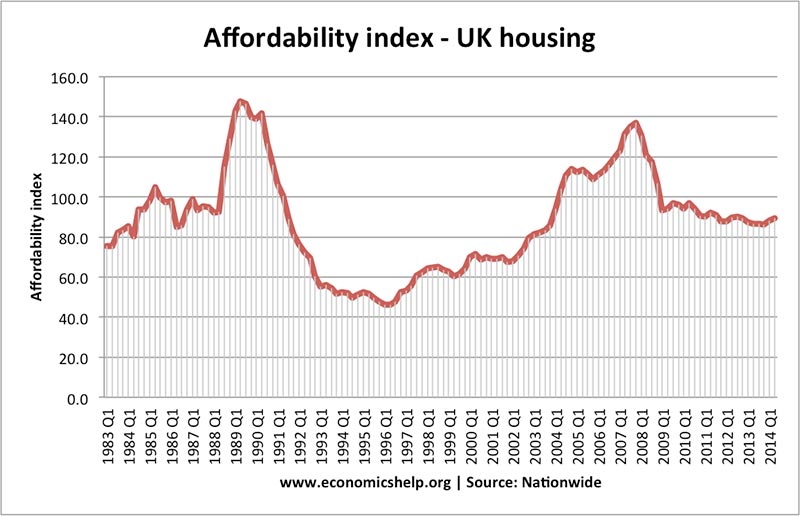
    UK housing – prices kept affordable by low interest rates.
  • House price to income ratios. House prices have risen much faster than incomes, meaning the younger generation are not able to get a mortgage. The average age of mortgage holders has increased, and the deposit required has also gone up. Because house prices are so expensive, there are many who cannot consider buying.
    ftb-house-price-earnings

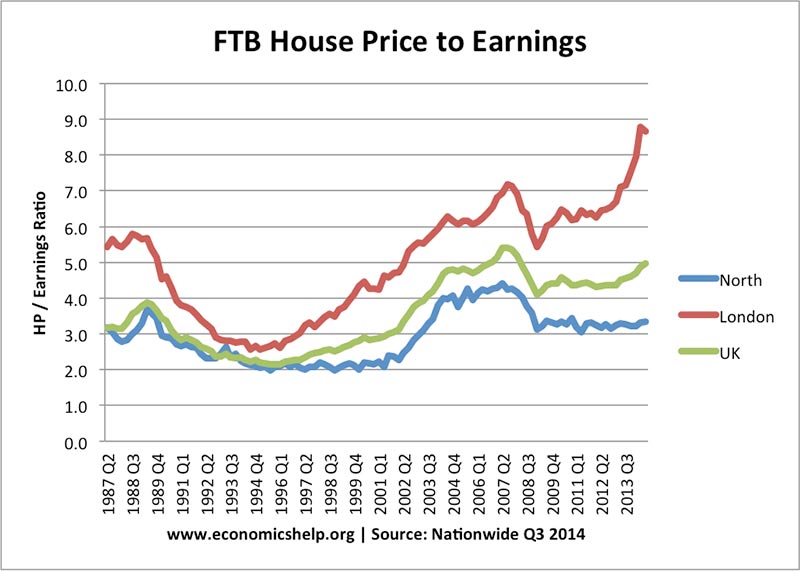
    House price to earning ratios for first time buyers. The ratio is 5.0 significantly higher than previous decades.

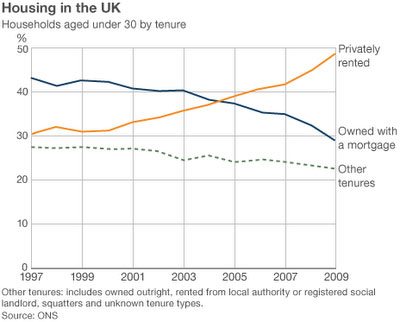
  • Buy to let market. With home ownership rates falling, the growth in demand for housing is coming from investors.

    housing

    These investors are more likely to be sensitive to changing house prices. If there is a sustained drop in prices, this may be magnified by investors leaving the UK housing market.

  • Economic growth is still fragile. Although the UK recovery is reasonably strong, the Eurozone looks weak with anaemic growth and the threat of deflation; there is a strong possibility that a weak EU economy could act as a drag on UK growth.

Read more

Paradoxes of Coalition Government

How has the coalition government fared on its economic policies? Firstly, there are quite a few paradoxes. Ignore own promises. The first paradox of the coalition government is the best thing they did was to ignore their own advice. When they came to power, they promised spending cuts, austerity and a balanced budget within a …

Read more

Government spending cuts to 35% of GDP

Firstly, I thought it might be helpful to talk about the different types of spending cuts that people refer to.

  • An actual cut in government spending. e.g. one year we spend £39bn on defence, the next year that is cut to £38 bn. This is a nominal cut of £1bn. The real cut will be even bigger.
  • A cut in real government spending. If inflation is 3% and government spending on education rises by 1%, that is a real cut of 2%. Departments will still have to cut back on wages and spending because with inflation higher than spending rises, they can afford less spending. It is fair to call this a spending cut
  • A cut in % of real GDP government-spending-percent-gdp-obr-14 Note figures for 2018-19 are a forecast. The big issues is that the Chancellor has proposed reducing the size of government spending as a % of GDP to lowest since 1948. Real government spending will rise, but as a % of national income it will be lower.

    Suppose, real GDP rises by 3%, but one department sees a rise in real spending of 1%. In this case, the department has a smaller share of national income, but at the same time has a real increase in the amount of money. This isn’t a cut in government spending, but it is cutting the share of GDP spent on that department.

  • A cut in quality of services. This is even more subjective. Suppose economic growth is 3% a year, but we increase the NHS budget by 4%. This is a real increase, and we are spending a higher % of national income on health. However, some may argue the demand for health care is rising by 8% a year due to rise in number of old people, rise in obesity e.t.c. Therefore, unless we match the demand for rising health care, it will lead to a cut in the quality of service and a rise in waiting lists. It is disingenuous to call a 4% real rise in spending a cut, but people’s experience of the NHS may feel like they are experiencing a cut.

Government spending as a pie chart

UK-government-spending

Which piece of pie should be cut?

Read more

Cut in UK stamp duty

The government have announced a change in stamp duty. The chancellor George Osborne claims the change to stamp duty will cut the rate of tax for 98% of house purchases.

New marginal tax rates are:

  • 0% tax on house purchases up to the value of £125,000
  • 2% tax on purchases between £125,000 and £250,000
  • 5% tax on purchases from £250,000 up to £925,000
  • 10% tax on purchases from £925,000 to £1.5m
  • 12% tax on purchases over £1.5m

The tax change will cost the public purse £800m and represent a £4,500 cut in tax on average home of £275,000.

UK stamp duty Source: Guardian

For an average priced home of £275,000, there will be £4,500 cut in stamp duty.

Commentary

Firstly, it makes sense to get rid of the old system, where a £1 increase in house price could cause £3,000 extra tax. Marginal tax rates avoid this tax-cliff, which distorted house sales around the stamp duty rates.

It is also very progressive, with a steep increase in tax rates for more expensive houses. In some ways the new stamp duty is a weak substitute for the proposed mansion tax.

However, there are two main problems.

1. This is not a good time for tax cuts. Given the need to improve public finances, it seems strange to offer a big tax cut on stamp duty. Revenues from stamp duty have already fallen significantly since 2008 because of lower house sale volumes. This tax cut will worsen public finances. It would be better to avoid a tax cut for stamp duty and have an extra £800m to spend on infrastructure (like for example, building affordable social housing).

Some might say, ‘But, you often argue for expansionary fiscal policy, so why not support a tax cut to boost spending and support economic growth?” – Well firstly, the aim of this tax cut is not to boost economic growth. If you did want to pursue expansionary fiscal policy, you would cut VAT or income tax. Increasing income tax threshold would increase consumer spending, but I’m not convinced a cut in stamp duty would have much impact. A cut in stamp duty is not really going to encourage people to go out and spend supporting a sustained economic recovery.

With stamp duty cut we get the worst of both worlds – we get a deterioration in public finances, but it doesn’t even offer much help to the economic recovery.

Read more

Why do bus companies run empty coach services?

advertising

Readers Question: Why may it still make economic sense for the company to put on a coach for just one or two passengers, rather than turning them away?

empty-buses

Recently I again had to travel to London by coach and discovered that it was a good idea to book early in case the coach was full! Was the coach company being more sensible now?

If a bus has a capacity of 80 seats. It might need an average of say 30 customers per trip to break even.

If the company are averaging less than 30 customers per journey, their fixed and variable costs will be higher than their revenue and eventually they will go out of business.

Can it make sense to run coaches that are nearly empty?

Running a coach service early in the morning or during winter may mean the bus company can expect less than 30 passengers. From one perspective, this does not make sense. It is below the break-even point – average revenue less than average cost. It may even be a case where the marginal cost is greater than the marginal revenue from an extra service.

In fact running services at unsocial hours of the morning will be unpopular with drivers, and the company may have to pay night-time rates.

However, there can be a good long term profit maximising logic behind running these services – even if only a few passengers use them.

  • Marketing. It is a strong marketing ploy to be able to offer 24 hour, 365 days coverage. If people know you run a service all around the clock, it will give them confidence to choose coach journeys as their preferred choice of transport.
  • Attract and hold onto long term customers. Only a few people may use an unpopular service. But, the 24 hour service will encourage many to get the coach in the first place. If customers fear they may turn up and no coaches are available, they may choose other forms of transport, such as car and trains and the company loses the business of customers.
  • If you lose a customer for one journey, the company might not lose very much. But, if the customer would make 50 journeys a year, that is different. Companies have to be aware that one bad experience could make the company lose their services for a long time.
  • Barriers to entry. If an existing coach company is running a 24 hour service, it may deter a new coach company from setting up. They may feel that they couldn’t compete with this all round performance, which makes the industry less profitable. On the other hand, a new company could be sneaky and just cherry pick the busiest times of the day to offer services.
  • Costs. Running a coach service will have both fixed and variable costs. Once you have bought coaches and given drivers an annual contract, the marginal cost of extra services will be relatively low – just the petrol and maintenance. Since you have already paid for many fixed costs (drivers annual salaries, buses, marketing) the marginal cost of an extra journey may be covered by just 10 or 20 passengers. Another way to think about it the topic. Would the company want to lay off drivers for a quiet time in winter? It may lose its drivers. The company might as well keep going through quieter periods.
  • Non-profit maximising decisions. We may assume every company is a profit maximiser. But, there maybe an element within the company, that they want to provide a good, all round comprehensive bus service, and they don’t mind if a few services are loss making.
  • Market share vs Profit. Another issue is that firms often concentrate on gaining market share, rather than profit maximisation. See: Profit vs Revenue maximisation

Read more

Benefit spending in the UK

A quick look at benefit spending in the UK. This is a follow up to  Social security spending. Thanks to HM Treasury for help in finding useful data set.

Source: Public Expenditure Statistical Analysis 2014 | Data Chapter 5 – 5.2

Social Protection spending

Firstly, there has been a modification to the category of government spending, now labelled – ‘Social protection spending’ – See: Social protection spending. This is not just welfare benefits. It includes personal social services, e.g paying for nursing, care in the community; (spending which could  perhaps be better included with health care).

Secondly, by far the biggest level of social protection spending is pension spending. This includes both state pension payments and (I believe) state occupational pensions to retired public sector workers.

social-protection

It is a very unwieldy sub-division of government spending, but if we look at whole budget it increased significantly during the great recession 2009-2013. This is partly due to the cyclical higher welfare payments expected during a period of unemployment and low income growth.

However, on closer examination, by far the biggest increase in spending from the social security budget is from pensions. Pension spending increased from £83bn in 2009/10 to £104.4 bn in 2013/14. An increase of £21 bn. In a period of so called austerity, that is a big increase in government spending.

  • Unemployment benefit payments fell in this period from £5.5 bn to £4.9 bn
  • Sickness and disability benefits rose from £30.6 bn to £37.5 bn
  • Income support, tax credit (both family and social exclusion) declined from (£45.8bn) to £ 43.9 bn)
  • Housing benefit from £22bn to £26bn (see: more on Housing benefit)

UK Pension spending

pension-spending-uk

Read more

Mansion tax – pros and cons

Wealth inequality UK

A mansion tax (or property tax) would be an annual progressive charged that would be paid by homeowners. It is effectively a tax on housing wealth. The Labour party has suggested implementing a property tax on homes worth over £2 million. Exact details have not been confirmed, but the suggestion is that it will be a progressive tax meaning the greater the value of the homes, the more the annual tax will be.

In 2010, the Lib Dems proposed a mansion tax based on 1% of a property’s value above £2m. This threshold would also rise in line with increasing house prices. In this case a property worth £2.5 million would pay an annual tax of £5,000 a year.

Proponents of the tax argue that it will help raise revenue, cool a booming property market and help to redistribute the great increase in wealth inequality that we have seen within the UK.

Critics argue that it could lead to people who are property rich, but income poor, struggling to pay the annual charge.

Benefits of a Mansion Tax

In recent decades, the UK has seen a dramatic increase in wealth inequality. House prices have risen above the rate of inflation making many homeowners much better off. But, those who cannot get on the property ladder are struggling with very high rents and an inability to get on the property ladder.

Wealth inequality UK Source: Wealth and Assets Survey – Office for National Statistics

A report by the ONS shows that there is considerable wealth inequality within the UK.

Read more

UK Social security budget

A look at how much the UK government spend on social security, benefits and welfare payments.

Note. I found it very difficult to find stats on how much the government spends on various benefits. The most helpful places were.

Headline stats

Total public spending 2013/14 – £686 billion.

  • Social security budget- £251 billion 37% of 2013/14 spending
  • State pensions account for £83 billion
  • Welfare spending of £168 billion or roughly 25% of budget
  • Benefit spending – of the £205 billion or so spent on tax credits and social security benefits, the IFS calculate about £111 billion is spent on those over pension age and £94 billion on those of working age.
  • Source: welfare spending at IFS

Benefit spending in the UK

The only breakdown I could find of benefit spending was from this Guardian data doc. Using original data from the Department of Work and Pensions .


Welfare benefits (billion, bn)

  • Housing benefit    £16.94
  • Disability allowance    £12.57
  • pensions credit +MIG    £8.11
  • iIncome support    £6.92
  • Rent rebates    £5.45
  • Attendance allpwance    £5.30
  • Incapacity    £5.30
  • Jobseekers allowance    £4.90 (0.7% of total spending)
  • Council tax benefit    £4.80
  • employment + Support    £3.58
  • sick + maternity pay    £2.55
  • Social fund    £2.37
  • carers allowance    £1.73
  • financial assistance    £1.24
  • Total £159


uk-welfare-payments

Main groups of welfare payments

  • State pensions    £74.22
  • housing benefits    £27.20
  • Disability benefits    £24.80
  • low income    £17.40
  • Jobseekers allowance    £4.90
  • others    £9.60
  • total    £159

Where:

  • housing = housing benefit + rent rebate + Council tax benefits
  • disability = disability allowance, incapacity benefit, carers allowance
  • low income support – pensions credit, minimum income guarantee, social fund

Read more

Item added to cart.
0 items - £0.00