The UK national debt is the total amount of money the British government owes to the private sector and other purchasers of UK gilts (e.g. Bank of England).
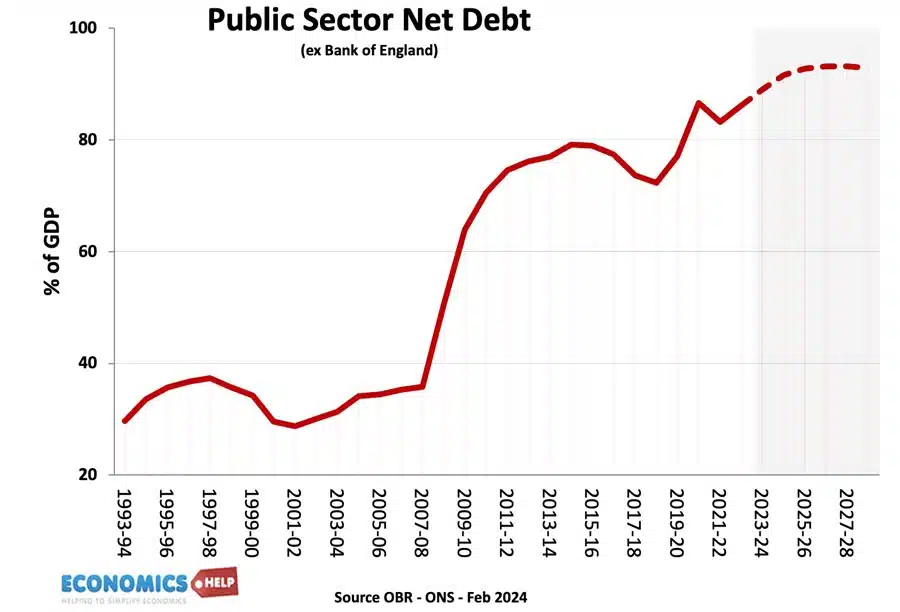
- UK public sector net debt (ex public sector banks) was £2,685.6 billion or 98.1% of GDP (20 Dec 2024).
- The OBR have forecast substantial rises in UK debt over the coming decade because of demographic factors, putting strain on UK spending.
- Source: [1. ONS public sector finances,- HF6X] (page updated 20 Jan 2024)
Source: ONS debt as % of GDP – HF6X | PUSF – public sector finances at ONS
Reasons for National debt
- Enables the government to spend more during periods of national crisis, e.g wars, pandemics, and recessions.
- In a recession, the government will automatically receive lower tax revenues (less VAT and income tax) and will have to spend more on benefits (e.g. more unemployment benefits) This causes a cyclical rise in debt.
- Extra government borrowing during a recession can help provide fiscal stimulus to promote economic recovery. By borrowing and then spending more, the government is injecting demand into the economy and this can help to reduce unemployment. This is known as fiscal policy and was advocated by J.M. Keynes.
- Strong market demand for government debt. Private investors buy gilts because they are seen as risk-free investments and there is also an annual dividend from the bond yield. Since 2009, there has been strong demand despite very low-interest rates, meaning the government can borrow very cheaply.
- Finance investment. The government could borrow to finance public investment projects that can lead to higher growth in the future.
- Political convenience. There is usually political pressure to cut taxes and increase government spending. Allowing debt to rise can be a way for the government to avoid difficult choices.
Forecast for the National debt?

Source: Fiscal risks and sustainability – OBR – Economic and Fiscal Outlook Oct 2024
The OBR have forecast that, on our given trajectory, UK public sector debt could reach 350% of GDP within 50 years. The pessimistic outlook for national debt is made because
- An ageing population and demographic changes will put increased pressure on government spending, notably health care and pension spending.
- A smaller working population will limit UK’s productive capacity.
- Stress on finances from geopolitical events, such as frostier relations with China, Russia and the Middle East.
- Higher energy prices
- Costs of climate change.
- Declining tax revenues from petrol in a decarbonising economy.
- Low productivity growth of UK since the financial crash of 2009
- Recent boost to debt from the financial crisis and one-off cost of Coronovirus pandemic, which cut tax revenues and required government support for lockdown measures.
UK debt in context
Predicting debt for the next 50 years is difficult since we don’t know what kind of productivity improvements may come, e.g. continued gains in renewable energy may reduce the burden of higher oil and gas prices. Equally, the costs of environmental change could be worse.
History of the national debt

Main article: History of UK national debt
UK national debt since 1900

Source: Reinhart, Camen M. and Kenneth S. Rogoff, “From Financial Crash to Debt Crisis,” NBER Working Paper 15795, March 2010. and OBR from 2010.
These graphs show that government debt as a % of GDP has been much higher in the past. Notably in the aftermath of the two world wars. This suggests that current UK debt is manageable compared to the early 1950s. (note, even with a national debt of 200% of GDP in the 1950s, UK avoided default and even managed to set up the welfare state and NHS.
Debt reduction and growth
The post-war levels of national debt suggest that high debt levels are not incompatible with rising living standards and high economic growth.
- The reduction in debt as a % of GDP 1950-1980 was primarily due to a prolonged period of economic growth. See: how the UK reduced debt in the post-war period
- This contrasts with the experience of the UK in the 1920s when in the post First World War, the UK adopted austerity policies (and high exchange rate) but failed to reduce debt to GDP. Debt in Post-First World War period.
Budget deficit – annual borrowing
This is the amount the government has to borrow per year.
- Government
- borrowing in the financial year to December 2024 was £129.9

Annual borrowing since 1950. Figures for 2023-24 are forecasts (and rather optimistic!)
Debt and bond yields
Bond yields a the interest that the government pay bond/gilt holders. It reflects the cost of borrowing for the government. Lower bond yields reduce the cost of government borrowing.

Between 2007 and 2020, UK bond yields fell. Countries in the Eurozone with similar debt levels saw a sharp rise in bond yields putting greater pressure on their government to cut spending quickly. However, being outside the Euro with an independent Central Bank (willing to act as lender of last resort to the government) means markets don’t fear a liquidity crisis in the UK; Euro members who don’t have a Central Bank willing to buy bonds during a liquidity crisis have been more at risk to rising bond yields and fears over government debt.
See also: Bond yields on European debt | (reasons for falling UK bond yields)
Since 2021, bond yields have risen due to pick up in inflation

Cost of Interest Payments on National Debt

The cost of National debt is the interest the government has to pay on the bonds and gilts it sells. According to the OBR in 2023-24, debt interest payments will be £108 billion. (3.2% of GDP) or 5.2% of total spending. It is lower than in previous decades because of lower bond yields.
See also: UK Debt interest payments
The era of low interest rates post 1992 helped to reduce UK debt interest payments as a ratio of government revenue. However, with interest rates and borrowing increasing – debt interest cost have increased significantly.
Potential problems of National Debt
- Interest payments. The cost of paying interest on the government’s debt is very high. In 2011 debt interest payments will be £48 billion a year (est 3% of GDP). Public sector debt interest payments will be the 4th highest department after social security, health and education. Debt interest payments could rise close to £70bn given the forecast rise in national debt.
- Higher taxes / lower spending in the future.
- Crowding out of private sector investment/spending.
- The structural deficit will only get worse as an ageing population places greater strain on the UK’s pension liabilities. (demographic time bomb)
- Potential negative impact on the exchange rate (link)
- Potential of rising interest rates as markets become more reluctant to lend to the UK government.
However, government borrowing is not always as bad as people fear.
- Borrowing in a recession helps to offset a rise in private sector saving. Government borrowing helps maintain aggregate demand and prevents a fall in spending.
- In a liquidity trap and zero interest rates, governments can often borrow at very low rates for a long time (e.g. Japan and the UK) This is because people want to save and buy government bonds.
- Austerity measures (e.g. cutting spending and raising taxes) can lead to a decrease in economic growth and cause the deficit to remain the same % of GDP. Austerity measures and the economy | Timing of austerity
Who owns UK Debt?
The majority of UK debt used to be held by the UK private sector, in particular, UK insurance and pension funds. In recent years, the Bank of England has bought gilts taking its holding to 25% of UK public sector debt.

Source: DMO Debt Management Report 2022/23
- Overseas investors own about 28% of UK gilts (2022).
- The Asset Purchase Facility is purchases by the Bank of England as part of quantitive easing. This accounts for 26% of gilt holdings.
Total UK Debt – government + private
- Another way to examine UK debt is to look at both government debt and private debt combined.
- Total UK debt includes household sector debt, business sector debt, financial sector debt and government debt. This is over 500% of GDP. Total UK Debt
Private sector savings

When considering government borrowing, it is important to place it in context. From 2007 to 2012, we have seen a sharp rise in private sector saving (UK savings ratio). The private sector has been seeking to reduce their debt levels and increase savings (e.g. buying government bonds). This increase in savings led to a sharp fall in private sector spending and investment. The increase in government borrowing is making use of this steep increase in private sector savings and helping to offset the fall in AD. see: Private and public sector borrowing
Comparison with other countries

Although 107% of GDP is high by recent UK standards, it is worth bearing in mind that other countries have a much bigger problem. Japan, for example, has a National debt of 256%, Italy is over 157%. The US national debt is over 132% of GDP. [See other countries debt].
How to reduce the debt to GDP ratio?
- Economic expansion which improves tax revenues and reduces spending on benefits like Job Seekers Allowance. The economic slowdown which has occurred since 2010 has pushed the UK into a period of slow economic growth – especially if we consider GDP per capita growth. Therefore the further squeeze on tax revenues has led to deficit-reduction targets being missed.
- Government spending cuts and tax increases (e.g. VAT) which improve public finances and deal with the structural deficit. The difficulty is the extent to which these spending cuts could reduce economic growth and hamper attempts to improve tax revenues. Some economists feel the timing of deficit consolidation is very important, and growth should come before fiscal consolidation.
- See: practical solutions to reducing debt without harming growth
Other countries debt
See also:
Wow the figures are utterly overwhelming
Watch Zeitgeist Addendum. It will explain everything. You should then research my name and participate. If not, vite UK.
Meant to say Vote UKIP 🙂
The problem with the ballooning debt won’t end soon. If you look at Japan they have been fighting deflation by ‘building bridges to nowhere’ and their debt is greater than 200% of their GDP.
This is not looking too good, may take more than a decade to get back in the black or something a little more reasonable.
well another this the U.K sucks at
Can we have an end to the b******s that New Labour spent money like it was going out of fashion? If only! Don’t believe the c**p you read in the Daily Mail. In fact, New Labour kept up the same moneterist limitations in the economy (low wages, spending constraints on public spending) as the tories did.
Hospitals and Schools were usually built under PFI agreements, which actually ended up costing the taxpayer more than if the state had built them itself.
Wages and pensions never (repeat never) rose more than inflation. Spending on social housing was at an all time low. Spending on benefits, especially disability benefit were in for huge cuts. The minimum wage, now trumpeted as a major New Labour achievement, was resisted tooth and nail by both Blair and Brown. The minimum wage had to be forced through. At £5.80 an hour, it is obviously far too low to make any real impact on wage poverty.
New Labour were spendthrift? You must be joking!!
As part of your foreign aid supply BR90 bridges to Papua New Guinea and the Solomon Islands. This will assist the maintanence of the highway system in PNG and also provide jobs in the UK. Don’t send money send items that are produced in the UK to keep British people employed.
Assistance in construction of bridges and the employment of local labour will put money into the pockets of local people in PNG and not wasted in the administration of the aid.
It is well enough that people of the nation do not understand our banking and monetary system, for if they did, I believe there would be a revolution before tomorrow morning.
Henry Ford
THE BANKERS MANIFESTO
Congressman Charles A. Lindbergh, Sr. revealed the Bankers Manifesto of 1892 to the U.S. Congress somewhere between 1907 and 1917.
We (the bankers) must proceed with caution and guard every move made, for the lower order of people are already showing signs of restless commotion. Prudence will therefore show a policy of apparently yielding to the popular will until our plans are so far consummated that we can declare our designs without fear of any organized resistance.
Organizations in the United States should be carefully watched by our trusted men, and we must take immediate steps to control these organizations in our interest or disrupt them.
At the coming Omaha convention to be held July 4, 1892, our men must attend and direct its movement or else there will be set on foot such antagonism to our designs as may require force to overcome.
This at the present time would be premature. We are not yet ready for such a crisis. Capital must protect itself in every possible manner through combination (conspiracy) and legislation.
The courts must be called to our aid, debts must be collected, bonds and mortgages foreclosed as rapidly as possible.
When, through the process of law, the common people have lost their homes, they will be more tractable and easily governed through the influence of the strong arm of the government applied to a central power of imperial wealth under the control of the leading financiers.
People without homes will not quarrel with their leaders. History repeats itself in regular cycles. This truth is well known among our principal men who are engaged in forming an imperialism of the world. While they are doing this, the people must be kept in a state of political antagonism.
The question of tariff reform must be urged through the organization known as the Democratic Party, and the question of protection with the reciprocity must be forced to view through the Republican Party.
By thus dividing voters, we can get them to expend their energies in fighting over questions of no importance to us, except as teachers to the common herd. Thus, by discrete actions, we can secure all that has been so generously planned and successfully accomplished.
Wow these figures are an eye opener and a cause for concern
Someone asked where does the Uk borrow money from
The Answer : The IMF, where doe the IMF get its money’ eh from britain and othe wealthy countries, so we are paying interest on our own money?.
Now here is where it gets crazy, The USA owe britain $111 Billion the USA also owe Brazil, India and Mexico,
so why not get that back.
So we loan the popcorn eating fatties $111 billion and then ve we loan back our own money and pay £3.4 billion interest a month for borrowing our own cash.
Would you loan you neighbours your wages forcing you to borrow from your wife and pay your wife interest’ no .
We elected the idiots’ so we deserve what we get.
The war in Iraq was ” A liberation” then 3 weeks later it was a war, The credit crisis was a CASH FLOW problem then it became a debt, we bailed the banks out and bought their bad mortgage debts’ so where are all these properties’ what have we got for this debt.
We as a nation are been fleeced and a lot of people are making a lot of money while the poor and disabled and schoolkids and pensioners pay the price.
The Sting.