Readers Question: how to revise for a possible exam question like: discuss the likely effectiveness of ‘expansionary fiscal and monetary policies as means of closing the output gap’
Firstly write down the question on a blank piece of paper. Then try and revise in three parts.
Part One – Knowledge define terms
- Expansionary fiscal policy – an attempt by the government to increase AD, through increasing government spending and cutting tax, (leading to bigger budget deficit)
- Expansionary monetary policy – When the Central Bank cuts interest rates or increases money supply, through a policy like quantitative easing.
- Output gap. This is the difference between potential output and actual output. A negative output gap means that current real GDP is less than potential and therefore there is spare capacity / unemployment.
Part Two – Explain effect of fiscal and monetary policy on output gap
Expansionary monetary policy could involve cutting interest rates. If the Bank of England cut interest rates, this should stimulate aggregate demand. Firstly, lower interest rates reduce the cost of borrowing and therefore encourage consumers to spend on credit. Lower borrowing costs will also encourage firms to invest because it is cheaper to finance investment. Secondly lower interest rates will reduce the amount householders have to spend on mortgage interest payments and therefore they will have more disposable income; this should increase consumer spending. Overall, with higher C and I, we should see an increase in AD.
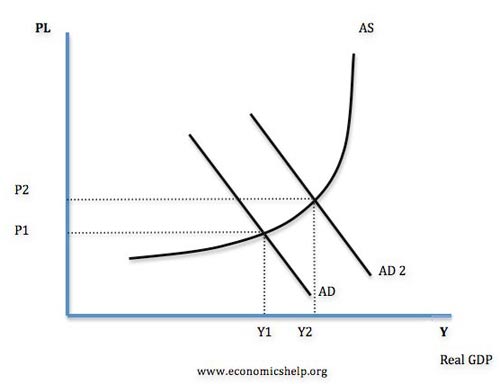
This increase in AD should lead to higher real GDP and reduce the output gap. At Y1, there is a significant negative output gap, Y1 is less than potential AS. Therefore, increasing AD does reduce the output gap.
Expansionary fiscal policy
The government could decide to borrow from the private sector and use this to spend on capital investment, such as building new roads and railways. This increase in government spending will increase AD and have a similar effect in increasing GDP. Alternatively, the government could cut the rate of VAT, this lower tax will give consumers greater spending power and should hopefully increase consumption; this should also increase AD, leading to great real GDP and reduce the output gap. There may also be a multiplier effect with the initial investment causing a bigger final increase in real GDP.
Part Three evaluation
For evaluation we need to discuss
- Will these policies actually be successful?
- What could determine with monetary and fiscal policy actually close the output gap?
- What might different economists say?
Evaluation for macroeconomics could involve several factors, such as:
- Other factors affecting AD
- Time lags
- It depends on the state of the economy
- It depends on side effects of policies implemented.