Budget deficit targets

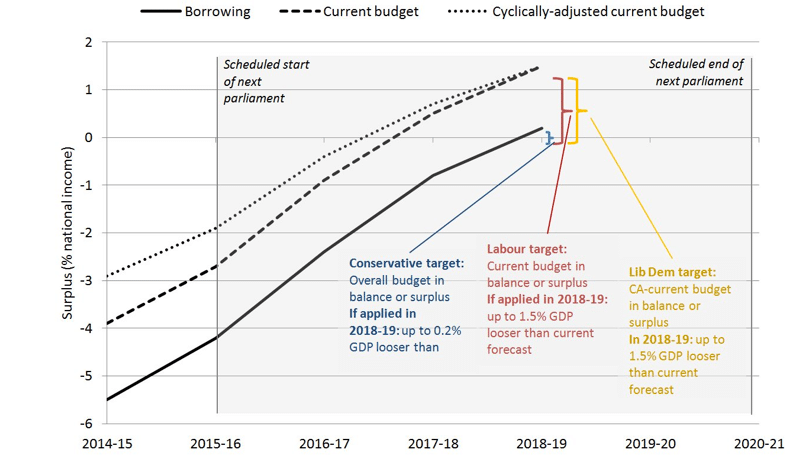
Politicians are often keen on making targets to eliminate budget deficits by a certain year. There is a strong political motivation to be seen as strong and committed to reducing government debt. Politicians who are vague about the debt are often heavily criticised and it is seen as poor politics. An advantage of budget deficit targets is that it ensure politicians have a stronger commitment to make politically difficult choices – raising taxes or cutting spending.

However, from an economic perspective targets for reducing budget deficits are not always as helpful as they may seem.

Benefits of budget deficit targets

There can be many sound economic reasons for reducing government borrowing. Just because a government can borrow, doesn’t mean it is desirable to.

  • It can prevent politicians choosing politically popular policies, such as tax cuts and spending increases. A deficit target can help prevent politicians putting off making difficult choices.
  • Without deficit reduction targets, some economists fear that there is an incentive to keep increasing the size of government spending, which crowds out more efficient private sector spending.
  • It can reassure markets that the government have a ‘responsible attitude to debt’ and are less likely to rely on printing money to finance the deficit and rely on inflation to inflate away the debt – which can reduce the real value of government bonds.
  • In some cases reducing the budget deficit can help lower bond yields because – with lower debt available on the market there is downward pressure on bond yields.
  • Some argue that budget deficit reduction gives consumers more to spend and firms to invest because the private sector have more confidence when the government is reducing its debt and is acting in a ‘responsible manner’. Others criticise this as being wishful thinking (see: Confidence fairy)

Problems of a budget deficit target

  • To stick to a strict budget deficit target may require tax increases / spending cuts at a time which is not appropriate for the economy. e.g. the UK economy is recovering, but if we increase income tax rates to improve tax receipts it may lead to lower growth and be counter-productive. See: Austerity can be self-defeating
  • Experience of Eurozone economies trying to meet budget deficit targets has been a deep recession.
  • Achieving an overall budget deficit means government have to finance investment spending out of tax revenue. But, arguably there is a better case for allowing government to borrow to finance investment.
  • A zero budget deficit is of doubtful value compared to other macro-economic objectives such as full employment, sustainable economic growth and low inflation.

Read more

Government borrowing and effect on bond yields and interest payments

Another few graphs to look at the impact of the UK budget deficit on bond yields and interest payments. Government net borrowing for 2012-12 excluding Royal Mail pension fund transfer and Asset Finance Programme (AFP – the proceeds from Q.E) Government borrowing vs debt interest payments The very large deficits have had  little impact on …

Read more

Impact of fiscal consolidation on debt levels

In recent years, I’ve frequently stated that fiscal consolidation can actually increase debt levels. It may seem a paradox because fiscal consolidation aims to reduce the budget deficit by increasing taxes and cutting spending. Yet, under circumstances, policies to reduce debt levels can actually cause a rise in debt to GDP. This seems to be …

Read more

Debt as % of Tax Revenue

Readers question: Why is public debt stated as a proportion of GDP and not as a proportion of the government tax take?

Generally, government debt is shown as a % of real GDP because this is best reflection of a countries ability to repay.

For example, in France, the government spends 52% of GDP (National Output). In Switzerland, the government spends just 32%. In France the government takes a higher share of tax than in Switzerland. If France and Switzerland had equal levels of debt, then Switzerland would look more indebted, because the debt would be a higher % of tax revenue. French debt would look a smaller burden because the tax revenue is relatively larger.

However, this wouldn’t completely reflect the ability to repay the debt. For example, if Switzerland had a high level of debt to tax, it is in a better position to increase tax rates to raise more revenue if necessary. France by contrast already has high tax rates, and when France tries to increases tax rates it may create disincentives (like famous movie stars moving to Russia).

Also, you could argue that a lower tax country like Switzerland will encourage more private enterprise and a stronger economy. If a country was strangled by high taxes. It would see it’s debt to tax ratio fall, but the economy may weaken.

However, although it is best to measure government debt as a % of GDP, it is still useful to examine debt as a proportion of government tax take. For example, some developing economies struggle to raise tax revenue. A large proportion of GDP may be beyond the government. If the government can only collect 10% of GDP in tax revenue, this limits their ability to repay even modest levels of debt. It is definitely worth taking into account.

Read more

Total UK Debt

  • When examining debt levels in the UK, there is government debt – measured by public sector borrowing (often referred to as National debt). See: UK National Debt.
  • We also have private sector debt which is composed of personal loans, personal mortgages, business debts, and debts of the financial sector.
  • Total Debt includes both private sector debt plus government debt.
  • Private sector debt can be split up into
    • Household debt – personal loans
    • Non-Finance corporates – Company debts
    • Financial – debts of banks and financial corporations

Total UK debt

total-uk-debt
total UK  Debt – Private + Public

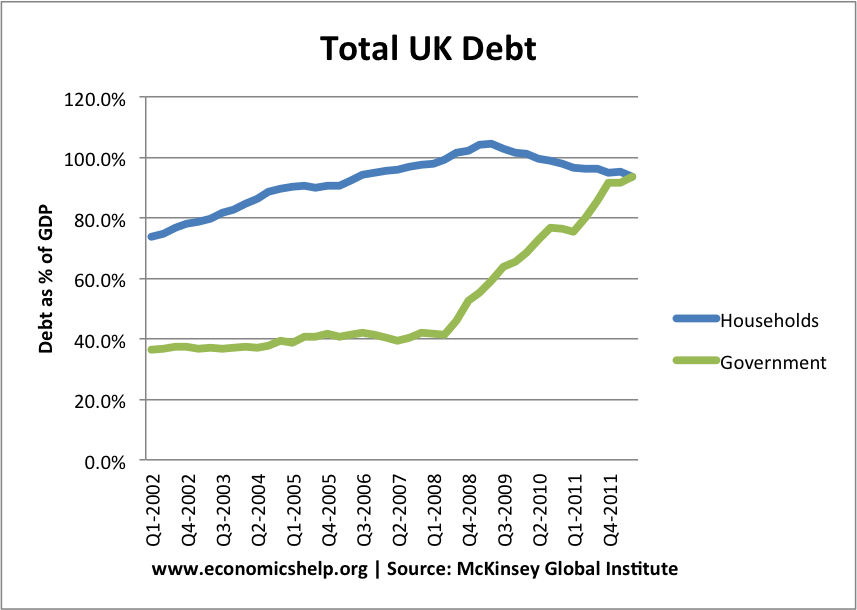
Total UK debt increased sharply in period 1994-2007.

household-government

Since 2008, there has been a fall in household debt as a % of GDP – as households cut back debt levels. (note GDP also fell in this period)

debt-sector-2007

Financial sector debt has stayed constant at 200% of GDP.

Main Features

  • Total UK debt is 500% of GDP in mid 2012
  • The largest component of debt is from the financial sector.
  • The deleveraging is greater than may appear from the statistics. Although debt levels have remained flat, this is against the backdrop of falling real incomes.

Compare experience of US – where total debt fell in period 2009-12.

Overall Indebtedness in Developed Economies

Source: Debt and Deleveraging pdf at McKinsey

The UK has seen the biggest rise in total UK debt in past 20 years. Only Japan is slightly higher.

Read more

Reason for Eurozone Credit Rating Downgrades 2013

Readers Question: Hello! I was just wondering in the midst of the European crisis when all economically strong countries have been downgraded? Many countries in the Eurozone have seen a downgrading in their credit rating for Government debt. The economic crisis saw a sharp rise in levels of government debt to GDP. In a recession, …

Read more

Causes of US Budget Deficit

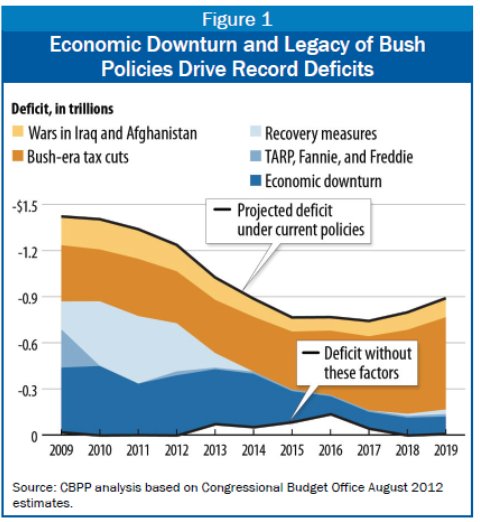
This graph illustrates some of the different causes of the US budget deficit.

causes-us-budget-deficit

Source: CBO estimates 2012 | via Krugman

This shows how the deficit has been affected by certain issues.

Cyclical factors

  1. Cyclical spending and lost tax revenues due to recession.
  2. Expansionary fiscal policy (economic recovery measures)
  3. Financial intervention to bailout banks and financial institutes.

Structural Factors

  • Bush tax cuts
  • Cost of wars (unexpected spending)

The particular graph doesn’t show other factors affecting the budget deficit, such as growth in health care spending, the cost of social security and factors related to an ageing population. But, it is interesting to see $0.9 trillion of the 2009 deficit (roughly 75%) was caused by cyclical factors.

Read more

Have the Government misled the public on UK debt?

Readers Question: The government keeps claiming that their harsh (but very necessary) austerity policies are working and that they have reduced the national debt by 24%, yet your graphs seem to totally disprove this claim. If anything, your graphs seem to show that the national debt is continuing to rise quite steeply, despite the government’s austerity policies, primarily because tax revenues are down and welfare payments are up because of the rising unemployment across the country (caused as far as I can see by the government’s austerity policies). Is the government painting a misleadingly and unfounded rosy picture to prove their policies are working, or am I failing to read your graphs correctly?

deficit

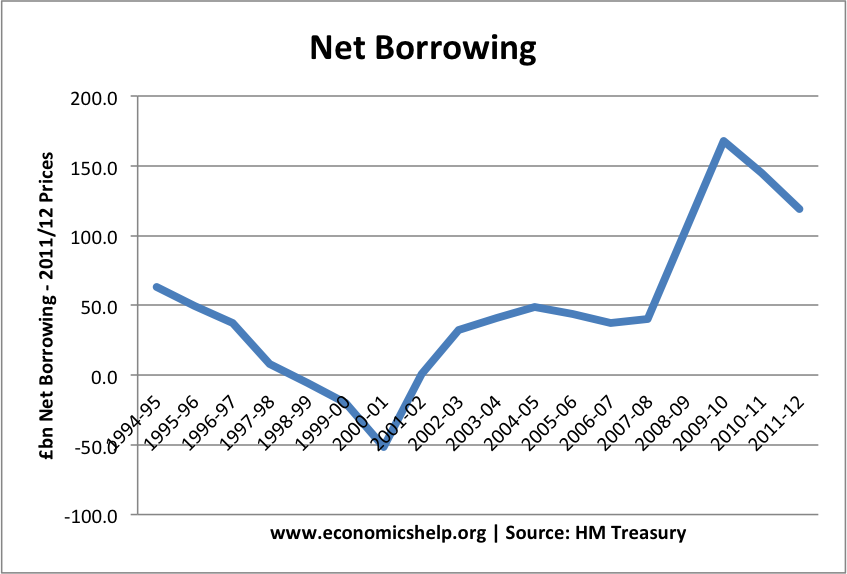
The government is correct to say that the budget deficit (Annual borrowing) has fallen by 25% since the peak of 2009-10.

debt

This means the national debt (total amount government owe) has increased at a slower rate than it might have done. But, it is still increasing rapidly.

Read more

Item added to cart.
0 items - £0.00