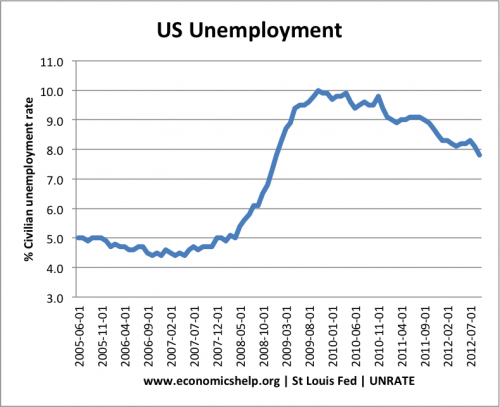
Casey B. Mulligan, from the University of Chicago suggests a theory for a major cause of the great recession and the rise in US unemployment post 2008. – Higher welfare payments.
..Redistribution, or subsidies and regulations intended to help the poor, unemployed, and financially distressed, have changed in many ways since the onset of the recent financial crisis. The unemployed, for instance, can collect benefits longer and can receive bonuses, health subsidies, and tax deductions, and millions more people have became eligible for food stamps.
Economist Casey B. Mulligan argues that while many of these changes were intended to help people endure economic events and boost the economy, they had the unintended consequence of deepening-if not causing-the recession.
The Redistribution Recession – Oxford University Press

There is also an article here at the NY Times (paywall): A Keynesian Blind Spot.
The decline of home construction is not the primary reason that our labor market remains depressed: Keynesian policies are
…


