What is Behind the Rise In Sickness Benefits?

sickness-benefit-caseload

The UK has seen a big rise in claims for sickness and other health-related benefits. According to the IFS roughly 1 in 10 working-age people now claim a sickness or disability benefit — up from around 1 in 13 pre-pandemic. Two things are going on An increase in the number of new claimants: this has …

Read more

Is UK Welfare Spending Out of Control?

out-of-work-benefits copy

In the past 12 years, UK welfare spending has increased by £100 billion, yet, it is forecast to grow even more. We are seeing record levels of health related benefits, by the end of the decade we could see other £100bn benefit spending related to sickness. The British press are up in arms claiming 6.5 …

Read more

The Great Recession 2008-13

economic-growth-quarterly

The great recession refers to the economic downturn between 2008 and 2013. The recession began after the 2007/08 global credit crunch and led to a prolonged period of low/negative growth, rising unemployment and a period of fiscal austerity. In particular, the great recession highlighted problems within the Eurozone which experienced a double-dip recession and high unemployment.
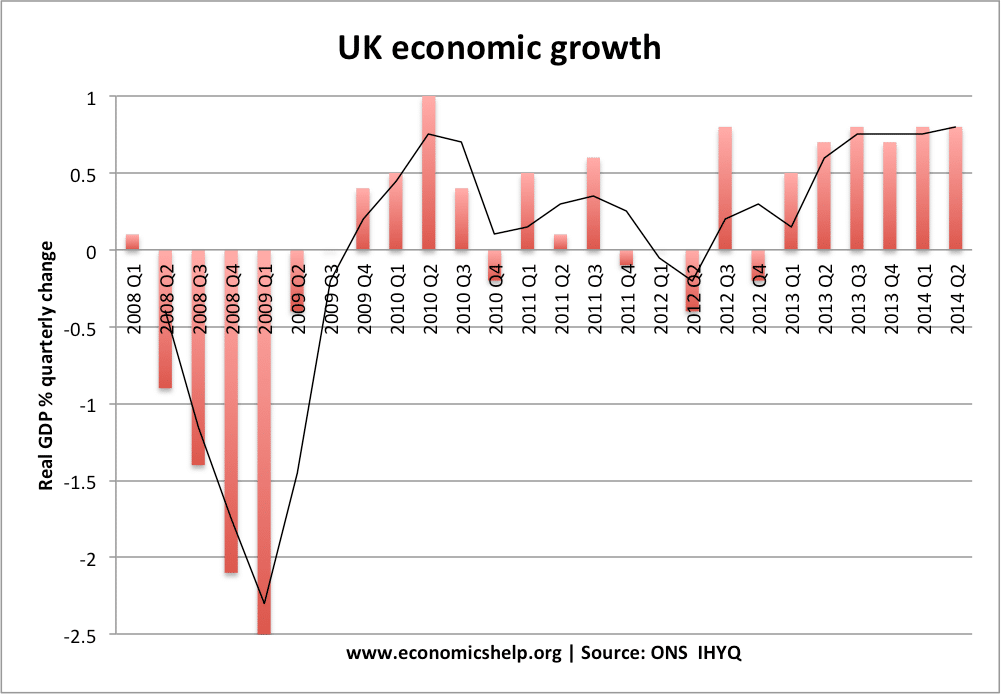
economic-growth-quarterly
This shows the sharp fall in real GDP in the UK economy in 2008 and 2009. It was also the slowest recovery on record.


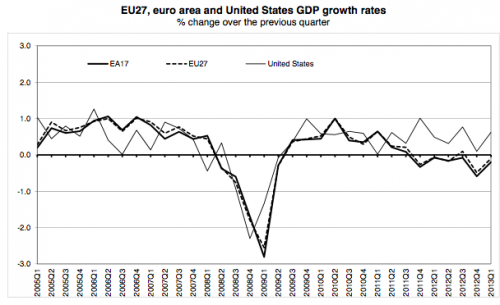
great recession

Recession in US and EU. Source: Eurostat

Output gap
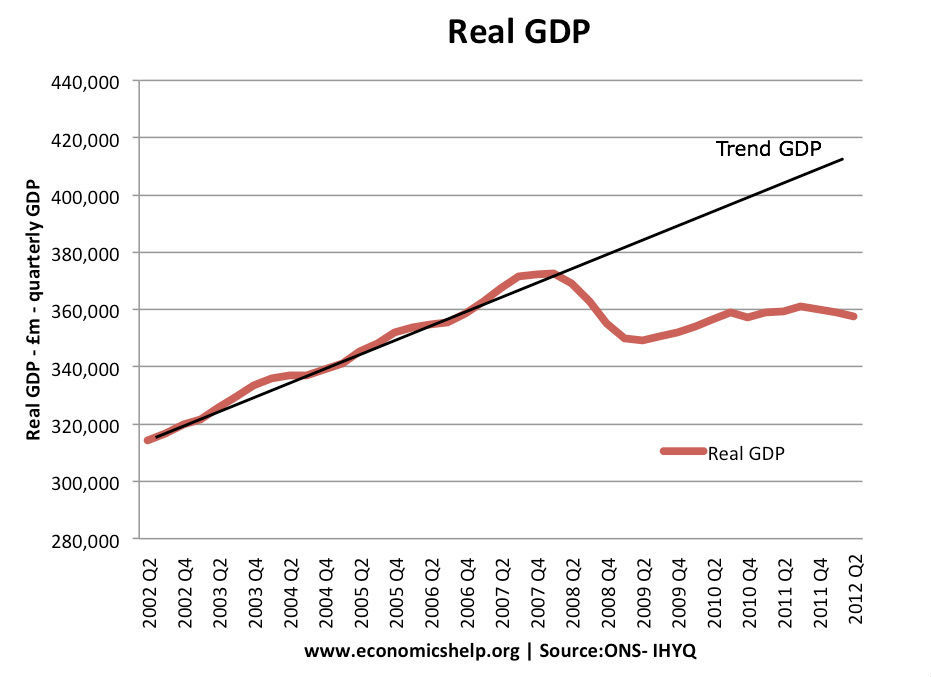
GDP-real-quarterly-actual

Graph showing how much real GDP fell behind the trend growth in the UK. Unlike previous recessions, the economy did not catch up the lost output.

Causes of the great recession 2007-08

The primary cause of the great recession was the credit crunch (2007-08) where the global banking system became short of funds, leading to a decline in confidence and decline in bank lending. The causes of the credit crunch were quite complicated but in summary.

  1. In 2000-2007, US banks made a big increase in sub-prime mortgage loans. These mortgages were very risky, but there was a good deal of ‘irrational exuberance‘ and belief house prices would keep rising.
  2. US mortgage companies sold these ‘risky mortgage bundles’ on to banks around the world. (Credit rating agencies gave them AAA ratings – despite the fact they were very risky.)
  3. Starting around 2005, US interest rates rose, and homeowners in the US began to default on these risky mortgages.
  4. US banks lost money, but also banks around the world later realised the ‘safe’ mortgage bundles they bought were actually useless. So many banks around the world saw a big fall in liquidity and value of their assets.

See more at: Credit crunch for a more detailed account

The recession was also caused by

  1. Credit crunch led to a fall in bank lending, due to a shortage of liquidity.
  2. Fall in consumer and business confidence resulting from the financial instability.
  3. Fall in exports from the global recession.
  4. Fall in house prices leading to negative wealth effects.
  5. Fiscal austerity compounded the initial fall in GDP.
  6. In Europe, the single currency created additional problems because of over-valued exchange rates, and high bond yields.

More details on causes of great recession
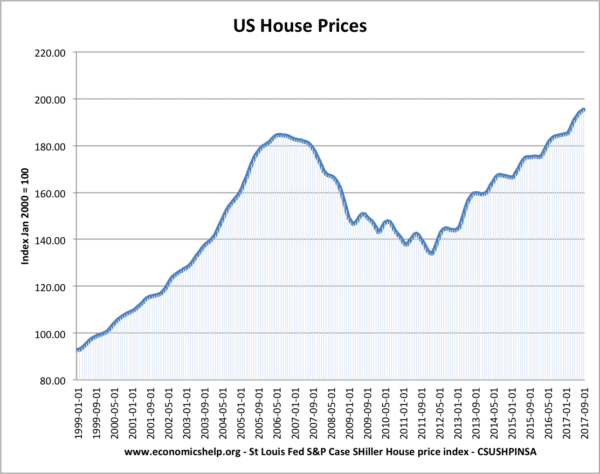
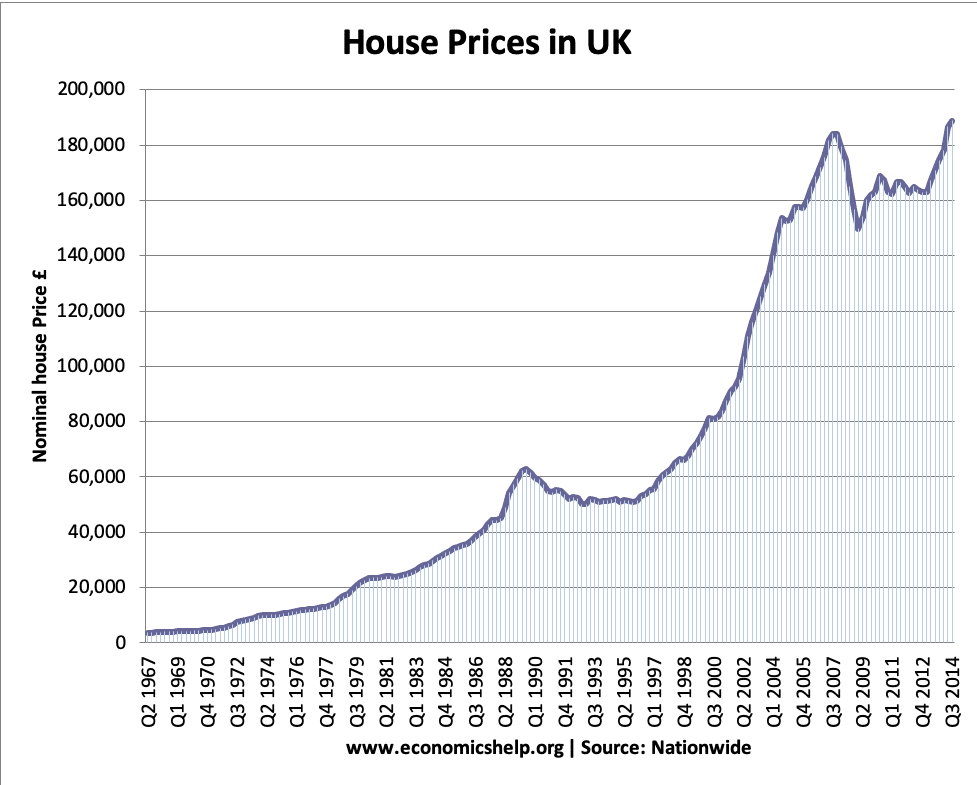
us-house-prices-99-17
US house prices boomed in mid 2000s, but then fell. The fall in prices, negative equity and bad mortgage loans were a big issue.
  1. Great Moderation. The period 2000-2007 was a time of strong economic growth, low inflation and falling unemployment. Central Banks appeared to be successful in targeting low inflation and ensuring economic stability. However, underneath the macro-economic stability, there was growing instability regarding credit and financial markets.
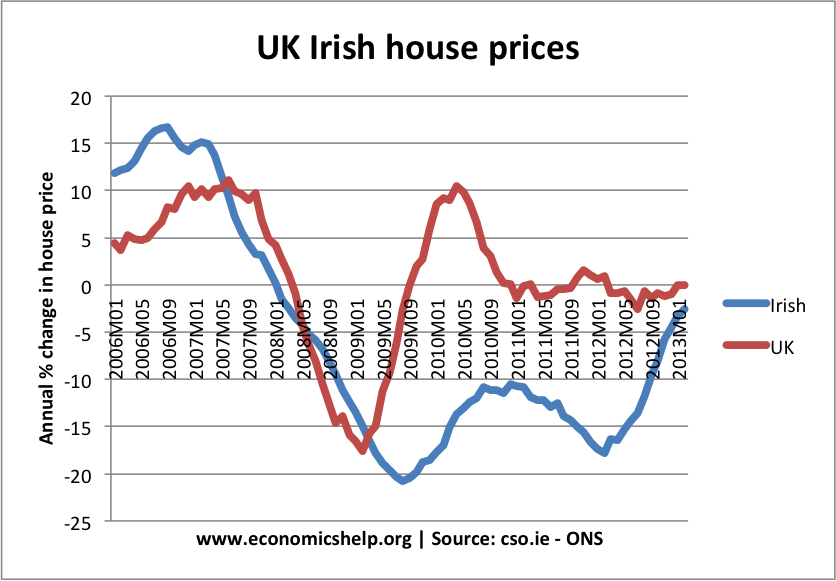
  2. Housing bubble. Many countries experienced a rapid growth in house prices. House price rose faster than inflation and faster than incomes. This boom in housing was encouraged by a growth in bank lending and high confidence. Several countries, such as Ireland and Spain also experienced a boom in house building.
    uk-irish-house-pricesIrish and UK housing price fall in 2008.
  3. Bad loans. In the period leading up to the credit crunch, banks became more aggressive and willing to take risks in lending. Especially in America, banks and mortgage companies loosened their criteria for giving mortgages. Many homeowners were given large mortgages, with limited checks on their ability to repay. However, in the economic downturn, people were left with mortgages they couldn’t afford.
  4. Bad loans repacked and resold. These ‘bad’ mortgage loans were sold onto other financial institutions around the world. For example, many UK and European banks bought these mortgage bundles from the US (CDOs) and so were exposed to any potential losses in the US housing market.
  5. Housing Bubble Burst. In 2006, the US housing market bubble burst. House prices started to fall, and there was a rise in mortgage defaults. Banks began to realise they had lost significant sums of money through the US mortgage defaults.
  6. Banks short of liquidity. The scale of bank losses started to increase and it became harder for banks to borrow money on money markets. This caused banks to reduce loans and mortgages. Because banks were losing money, it became challenging to get credit and liquidity. Some banks lost so much they were running out of money. In several countries, such as UK, Ireland and US, major banks had to be bailed out by the government. But, the realisation banks were short of liquidity harmed consumer and investor confidence. The fall in confidence led to lower spending and investment.
  7. Rise in oil prices. In 2008, there was also a peak in oil prices. This complicated matters because it caused cost-push inflation. This cost-push inflation made Central Banks more reluctant to cut interest rates. Also, higher oil prices reduced discretionary income and led to lower spending. Usually, in a recession, oil prices fall. However, because of rising demand in China and India, we saw rising oil prices – even as Europe and the US went into recession. High oil and commodity prices was another factor reducing demand.
oil-price-shocks-real-72-25-labels-2

The oil price surge in 2008 came at a very bad time for struggling economies.

The impact of the credit crunch and recession

  • In 2008, all major economies experienced a very sharp drop in real GDP. The banking crisis severely curtailed normal bank lending. The result was a fall in investment and consumer spending leading to a sharp drop in real GDP.
  • The fall in house prices was another factor leading to recession. In the boom years, rising house prices (and wealth) underpinned higher consumer spending. When house prices dropped, many homeowners faced negative equity. Therefore, they cut back on spending and could no longer rely on re-mortgaging to gain equity withdrawal.
  • The global nature of the crisis meant that there was also a drop in world trade. Countries saw a drop in exports as the global downturn led to lower demand.
  • Unemployment. Unemployment rose in US and Eurozone.
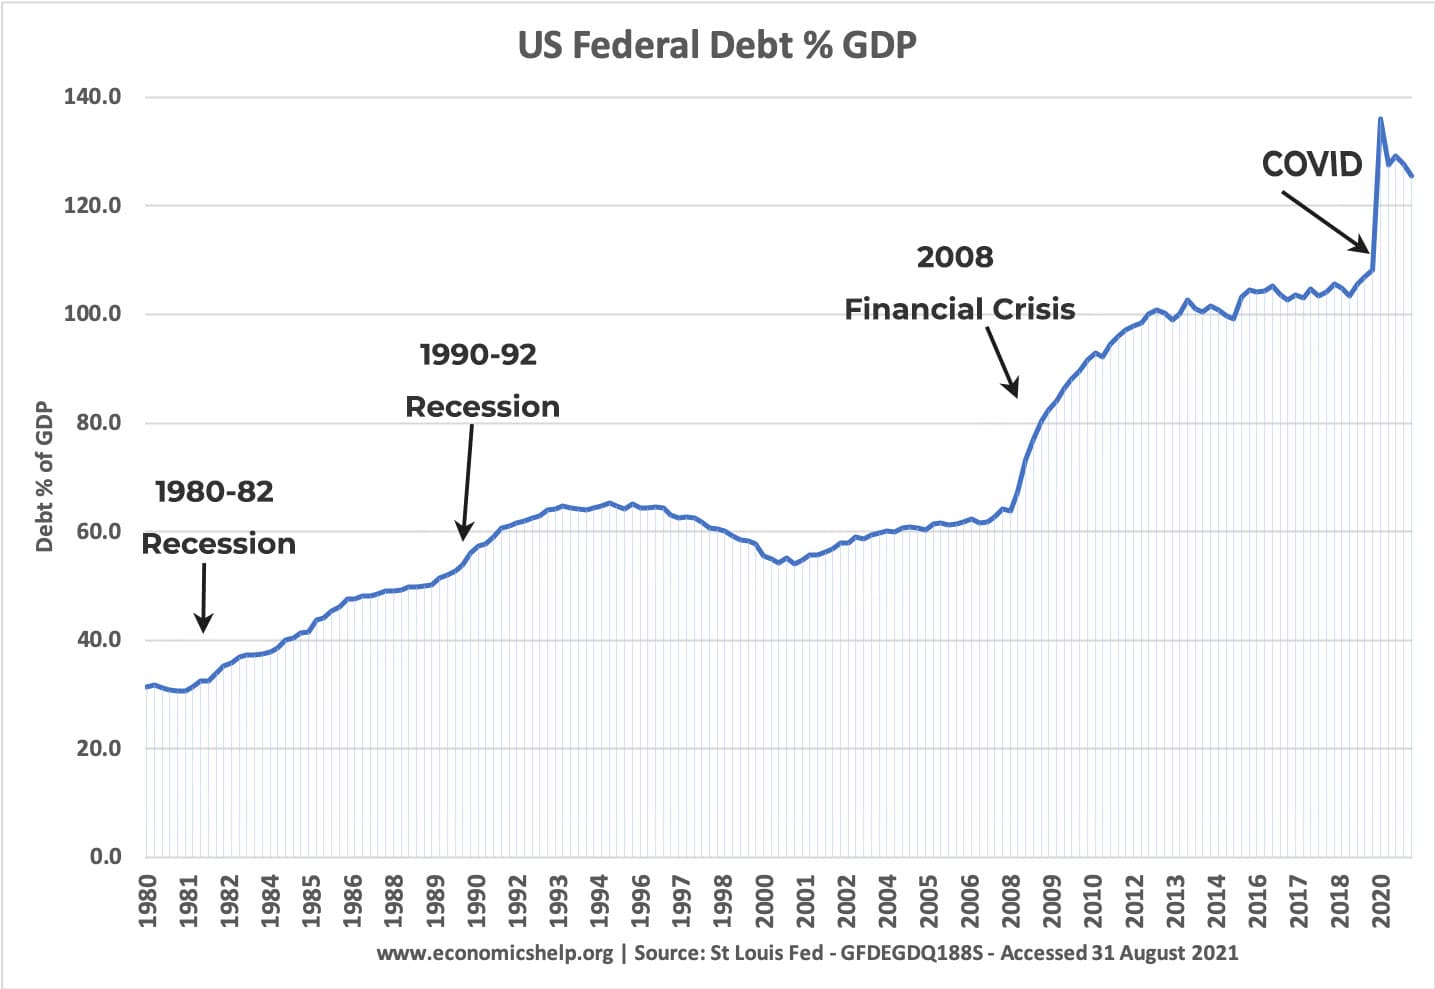
  • Government debt. Government debt rose sharply due to the recession. This ushered in a period of ‘austerity’ with many governments in Europe seeking to cut spending.
  • Euro crisis. The Eurozone saw a rise in bond yields in 2010-12 – partly due to recession, and also due to lack of Central Bank willing to intervene.

Response to the Great Recession

  • Bank rescues. Firstly, governments felt obliged to intervene in the banking sector to avoid banks and financial institutions going bust. However, there was some reluctance to bailout those who were blamed for causing the crisis. In 2008, the US decided to allow Lehman Brothers to go bust. This caused a major loss of confidence. After the panic this created, governments realised they couldn’t allow a repeat of this experience. In the UK, the government intervened to bailout out major banks, such as Northern Rock, and Lloyds TSB.
inflation-interest-rates

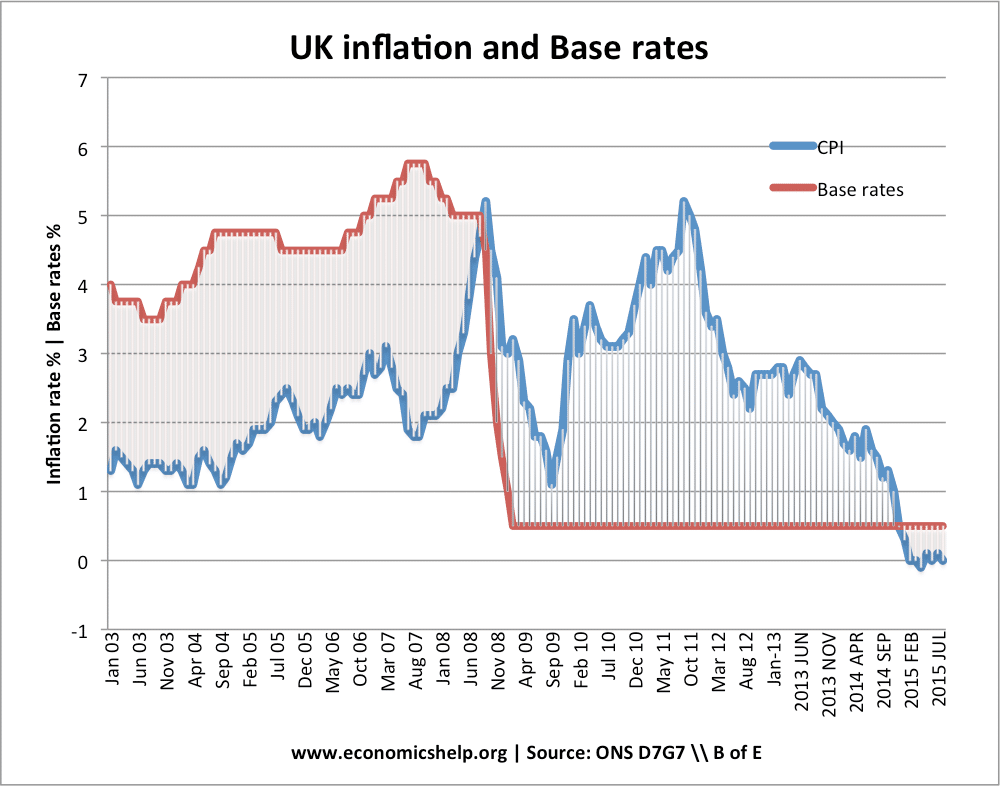
  • Cuts in interest rates. Towards the latter half of 2008 and early 2009, Central Banks cut interest rates to record low levels. The UK cut base rates from 5% to 0.5%. Usually, a major cut in interest rates would make borrowing cheaper and encourage consumption and investment. (e.g. in 1992, when the UK cut interest rates, the economy recovered fairly quickly.) However, cuts in interest rates were less effective in this period.
  • Expansionary fiscal policy. The deep recession saw a sharp rise in budget deficits because government tax revenues evaporated. This was particularly noticeable for countries who relied on stamp duty and tax from the finance sector. However, in the UK and US, there was a moderate degree of fiscal expansion. The UK introduced a temporary cut in VAT. In the US, there was also a moderate fiscal stimulus.
  • It is worth noting that in comparison to the great depression of the 1930s, two things were avoided in the great recession.
  1. Large number of banks going bankrupt was avoided (In the 1930s, in the US over 500 commercial banks went bankrupt)
  2. There was no major trade war. In the 1930s, a tariff war developed as countries tried to protect domestic industries.
Read more

List of National Debt by Country

us-debt-percent-gdp-1980-2021
  • This is a list of the gross national debt of 178 countries, showing the variation in debt levels from Venezuela at 234% of GDP to Turkmenistan at 4.6% of GDP.
  • National debt refers to the amount of total government debt a country has. This is also referred to as ‘public sector debt’.
  • It is compiled using data from the IMF.
  • Note: National debt is different to ‘External debt‘ – External debt includes all the debt a country (both private and public sector) owes to foreigners.
  • Updated 19 Dec 2025

Debt of selected economies

top-10-debt-share-gdp

List of National Debt by Country

Levels of general gross government debt. Debt levels as % of GDP for 2024 (accessed Dec 2025)

Full List of Countries debt share

Debt % GDP
1Japan236.7
2Venezuela164.3
3Greece150.9
4Italy135.3
5United States120.8
6France113.1
7Canada110.8
8Belgium104.5
9Spain101.8
10United Kingdom101.3
11Portugal94.9
14Egypt90.9
15Ukraine89.8
16China88.3
17El Salvador87.6
18Brazil87.3
19Finland82.5
20India81.3
21Austria81.2
22Hungary73.5
23Yemen70.9
24Malaysia70.4
25Israel67.8
26Slovenia67.0
27Cyprus65.3
28Germany63.9
29Montenegro62.6
30Colombia61.3
31Costa Rica60.2
32Iceland59.1
33Slovak Republic58.0
34Croatia57.6
35Thailand57.2
36Philippines57.1
37Panama56.6
38Albania55.7
39Poland55.3
40North Macedonia54.8
41Romania54.6
42Nigeria52.9
43Korea, Republic of52.5
45Australia49.8
46Tanzania48.2
47Malta47.4
48Latvia47.4
49Serbia44.5
50Belarus44.4
51Mongolia44.4
52Netherlands43.2
53Czech Republic43.0
54Norway42.7
55Chile42.0
56Honduras41.1
57Ireland41.1
58Indonesia40.2
59Nicaragua39.1
60Lithuania38.2
61Moldova38.1
62Georgia37.9
63Switzerland37.6
65Vietnam32.9
66Bosnia and Herzegovina32.8
67Uzbekistan32.6
68Sweden32.6
69Ethiopia32.3
70United Arab Emirates32.1
71Peru30.9
72Tajikistan29.5
73Denmark28.0
74Cambodia26.6
75Taiwan Province of China26.2
76Luxembourg26.0
77Türkiye26.0
78Kazakhstan24.8
79Bulgaria24.1
80Estonia23.6
81Russian Federation20.3
82Congo,19.3
83Nauru17.6
84Kosovo16.9
87Kiribati9.9
88Turkmenistan4.6

a

Source: IMF 

Source: IMF DataSet, accessed 1 September 2021

Highest levels of Government debt in the world

The country with probably the biggest debt problem is Venezuela. Because of hyperinflation, sanctions, a collapsing economy and a failure to collect tax revenues they can’t even borrow on international markets.

The country with the highest debt to GDP ratio in 2020 was Japan (234%) – a reflection of an ageing population. The Japanese government is able to borrow from private individuals in Japan because of high saving rates. But, as Japan sees a return of inflation and higher debt, this is becoming more problematic.

Lowest levels of government debt in the world

The country with the lowest levels of debt is Turkmenistan – an reflection of its natural-gas–based economic model and political choices, rather than broad economic strength. Turkmenistan has some of the world’s largest gas reserves and gas exports (especially to China) generate large foreign-currency inflows. The government often funds spending from energy revenues, reducing the need to borrow

Some very poor countries like Afghanistan, Congo and Haiti have perhaps surprisingly low levels of debt. One reason is that the country does not have functioning bond markets. There is so much uncertainty that governments do not have the opportunity to borrow.

Problems of national debt

High levels of national debt can cause these potential problems

  1. Requirement of higher taxes and/or lower spending
  2. Higher debt interest payments
  3. Pressure to print money – causing inflation.
  4. Debt financed by overseas borrowing can lead to external pressure
  5. Crowding out of the private sector

See: more problems of government borrowing

How much can a government borrow?

  • Japan’s national debt is 236% of GDP and has been high for a couple of decades. This reflects the ability of Japan to borrow from domestic citizens. Despite prolonged periods of high debt, interest rates are still low because markets feel the government is still solvent.
  • A developing economy like Argentina has a track record of default on debt, therefore markets are less willing to lend money to the government. Therefore when debt levels in Argentina increase it has a greater effect on pushing up interest rates.

Factors that depend on how much a government can borrow include

  • Default rates of government
  • Inflationary pressures. High inflation will make investors less willing to buy government bonds because they will devalue due to inflation
  • Can the government print its own money? If the government can print money it can avoid liquidity issues, though there is potential danger of inflation.
  • What are the prospects for economic growth? Higher economic growth makes it easier to reduce debt to GDP ratios over time.
  • How much can a government borrow?

Difference between debt and deficit

Government debt is the total amount of outstanding liabilities.  The deficit is the annual amount by which spending exceeds income. The debt is the accumulation of past deficits.

For example in 2025, the US deficit was $1.8 trillion The US total debt is $38 trillion.

Causes of national debt

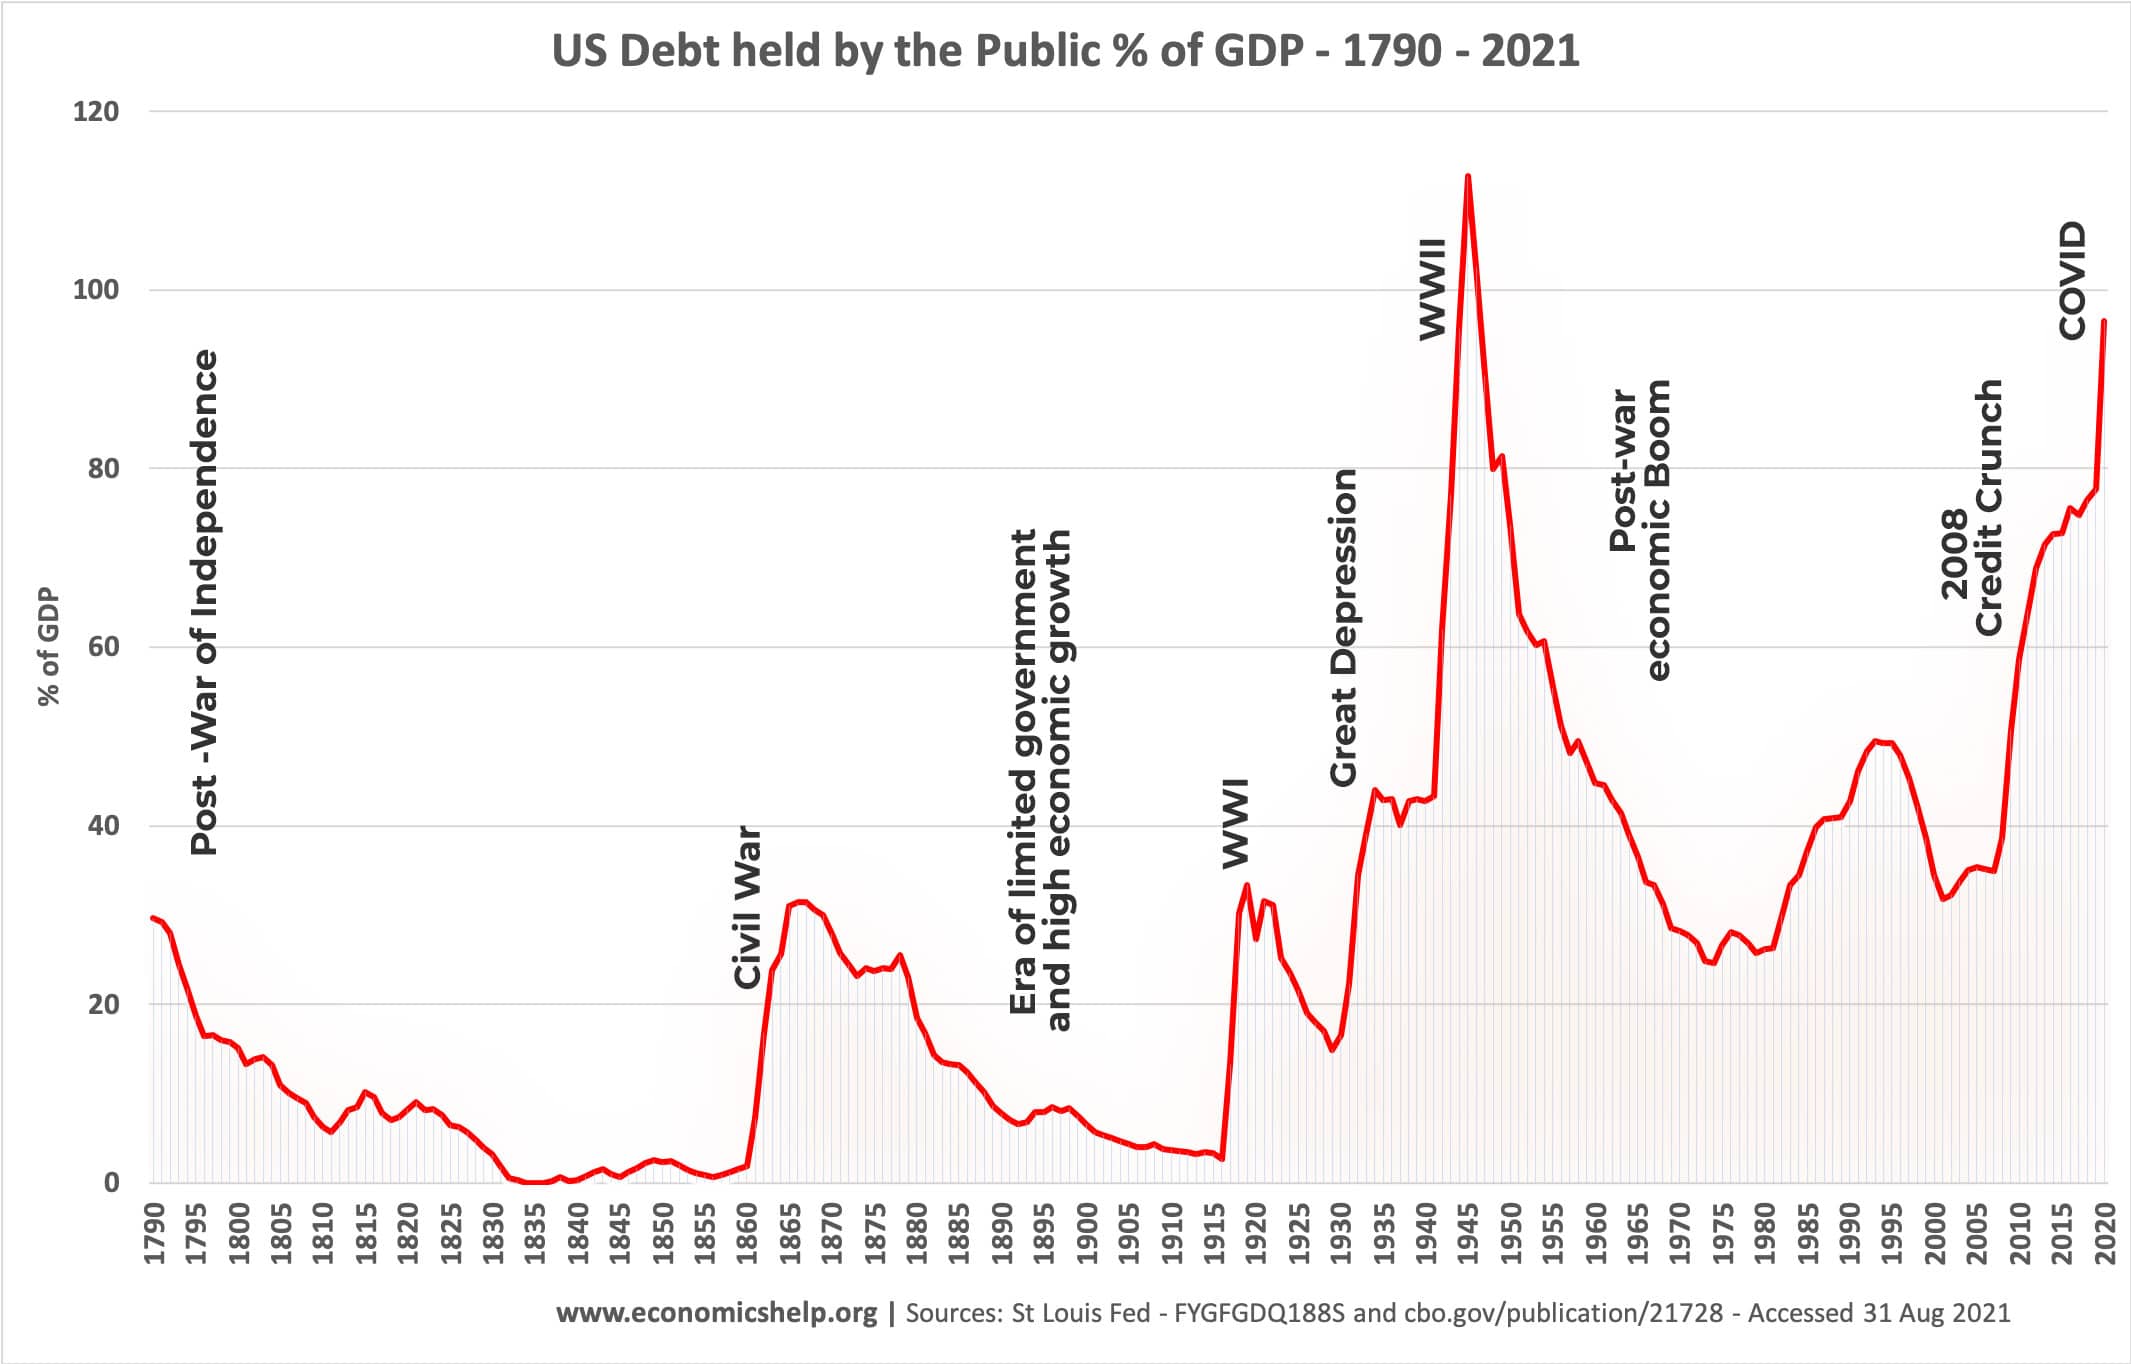
us-national-debt-held-public-1790-2021

This graph for US national debt shows how national crisis leads to a rise in government borrowing. This isn’t necessarily a bad thing. Government debt enabled the US government to finance the short-term costs of the two world wars. It also enabled the government to respond to the crisis of the 2008 financial crash and the 2020 Covid crisis. Causes of national debt can include

  • Recession – tax revenues fall when the economy shrinks. Also the government spend more on unemployment benefits
  • Investment – Governments might borrow to build new roads, schools and hospitals.
  • Finance war –
  • Demographic changes and welfare spending. An ageing population tends to place more strain on government finances with older people requiring more health care spending, pensions and also they pay less income tax.
  • Political decisions. Some governments may support higher spending on welfare programmes, whearas other governments may target a balanced budget.

Related

Read more

Pros and Cons of Wind Energy

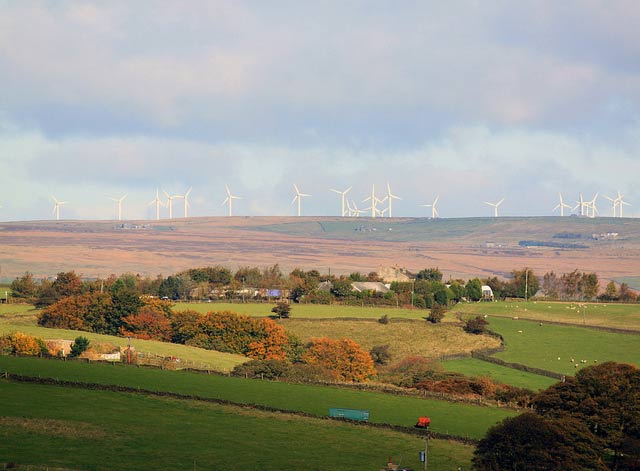
wind-farm

Wind farms seek to offer an environmentally sustainable source of energy that will help reduce our dependence on non-renewal fossil fuels. However, this clean and safe source of energy is controversial with many opposed to its use, often on grounds of aesthetics or lack of efficiency and cost of subsidies. This looks at the pros …

Read more

How do economists try to predict inflation?

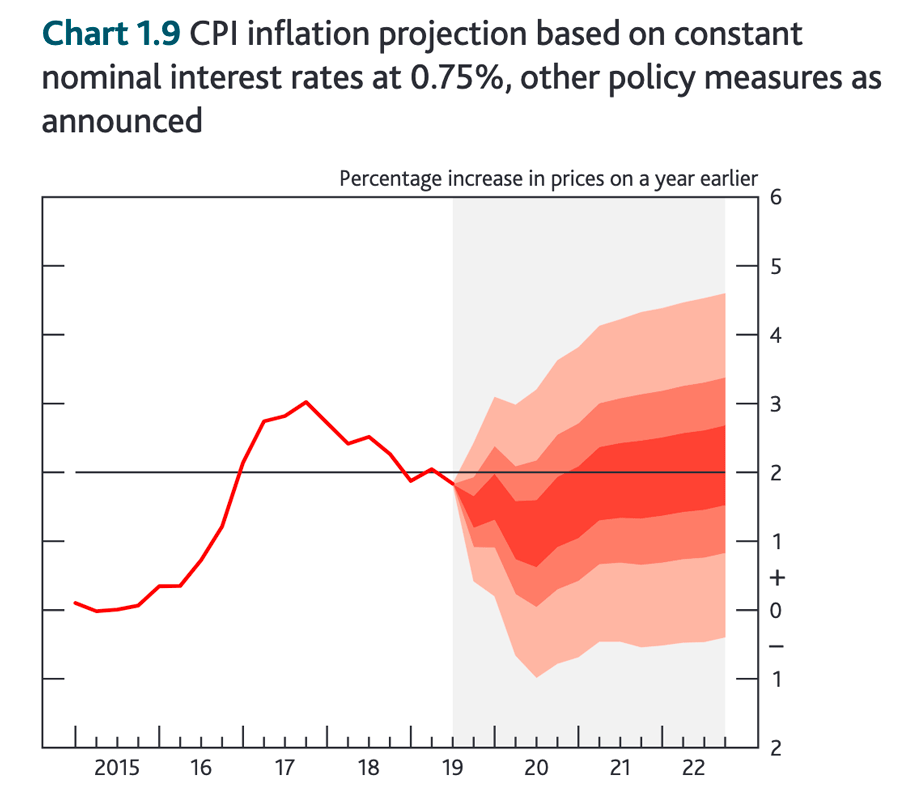
inflation-prediction

Readers Question: How does the Bank of England (MPC) predict future inflation? The MPC will look at many statistics which give an indication of whether the economy is reaching full employment and causing inflationary pressures. This will include rate of economic growth, unemployment and the amount of spare capacity (output gap) in the economy. Inflation …

Read more

Why UK Energy Prices are so High?

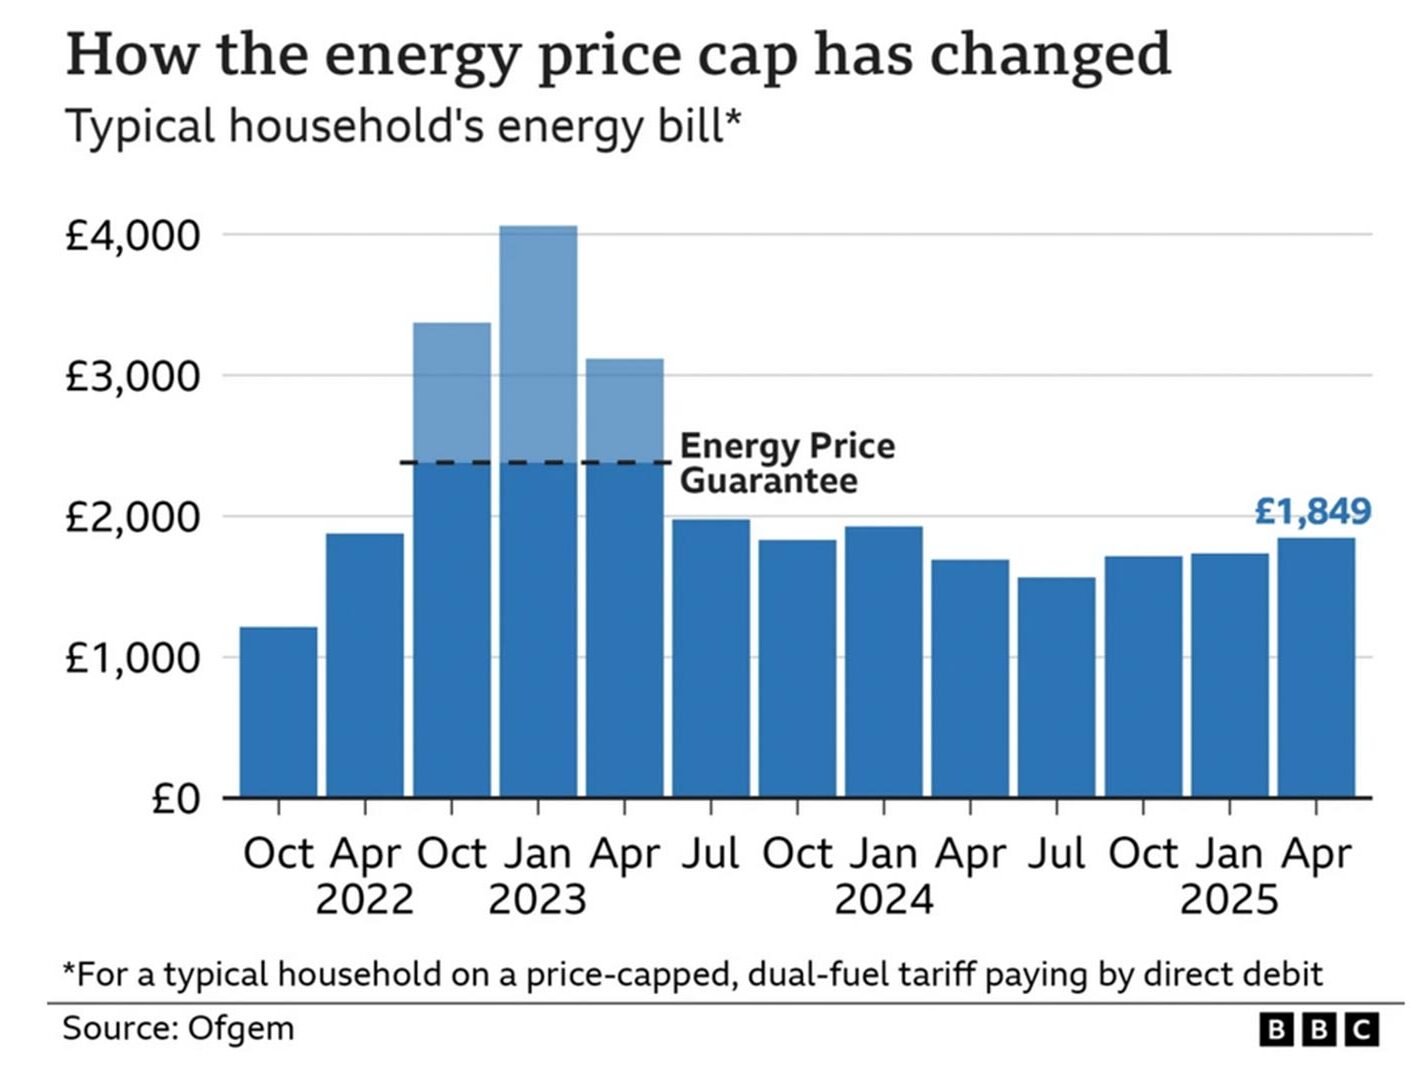
energy-price-cap-bbc

In 2025, the energy price cap will rise to £1,758 per year,nearly 70% higher than 2021 It’s not just households experiencing a rise in energy costs, IL businesses face the highest cost of electricity in Europe. It is proving very damaging for the remaining industrial sectors in the UK, with the chemical industry really hard …

Read more

Item added to cart.
0 items - £0.00