A look at the pros and cons of Scottish independence from an economic perspective.
It is said you can’t put a price on freedom and cultural identity. But, when it comes to independence, economics seems to be one of the biggest factors to sway voters in Scotland. When asked in a poll, only 21% favour Scottish Independence if it leaves them £500 a year worse off. Only 24% favour retaining union with Britain if it leaves them worse off. (Economist)
Benefits of Scottish Independence
- Oil and Gas Reserves in the North Sea are potentially a lucrative source of tax revenue and this has become more profitable with higher oil prices. According to the Scottish government, Scotland represents 8.4 per cent of the UK’s total population, but they generate 9.4 per cent of its annual revenues in tax — equivalent to £1,000 extra per person. (link) However, with dwindling reserves, income from oil and gas may dry up in future years.
- Independence may give freedom to set low corporation tax rate and attract business from overseas.
- Reform of tax and welfare system. Crawford Beveridge, chairman of the Scottish Fiscal Commission, claims that smaller countries, such as Ireland and New Zealand have considerable success in collecting tax. He argues an independent Scotland could scrap 1,000 tax exemptions and make the tax system simpler and encourage greater work incentives. “The UK tax system is complex and costly, and does not fully reflect the unique characteristics and needs of Scotland. There is considerable room for improvement in its design and operation.”
- Some argue that independence might increase self-confidence of the country, attracting more business and tourism. It may enable Scotland to have a stronger brand loyalty for its traditional exports like whisky and tartan kilts.
Costs of Scottish Independence
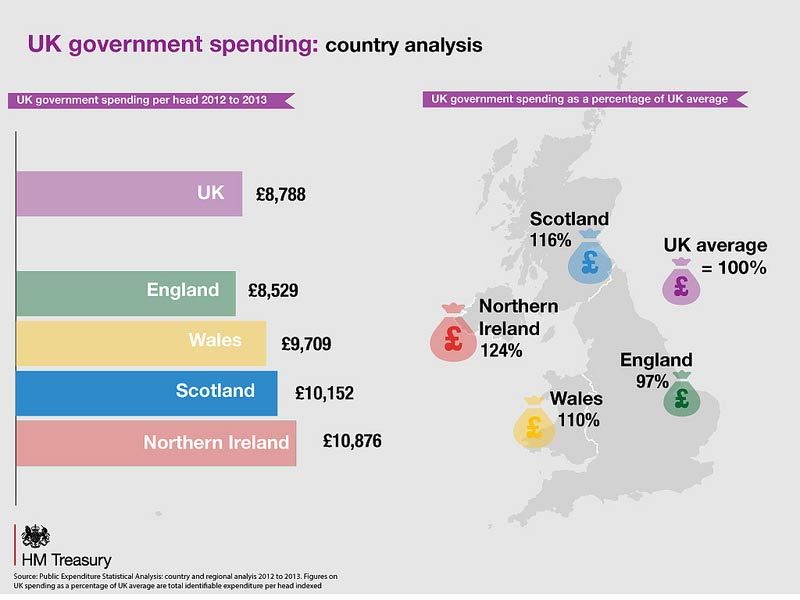
- Would lose ‘subsidy’ from Westminster. Scottish people get around £10,212 spent on them every year by the UK government, compared with around £8,588 — £1,624 less — for people in England. Independence may make it more difficult to maintain this spending. Independence may end some of the generous subsidies in Scotland for university education, trains and health care. However, this Scottish ‘subsidy’ is controversial as oil and gas revenues help give a Scotland bigger (£1,000) per capita tax revenue (New Statesman)
- Debt Levels. After independence, UK debt levels would be share on a per capita or per GDP level. This would leave Scotland with a national debt of £80bn and growing. Although debt would be split according to the respective GDP, the recent experience of smaller countries on the Eurozone periphery mean that Scotland may struggle to meet debt payments