The UK national debt is the total amount of money the British government owes to the private sector and other purchasers of UK gilts (e.g. Bank of England).
- UK public sector net debt (ex public sector banks) was £2,685.6 billion or 98.1% of GDP (20 Dec 2024).
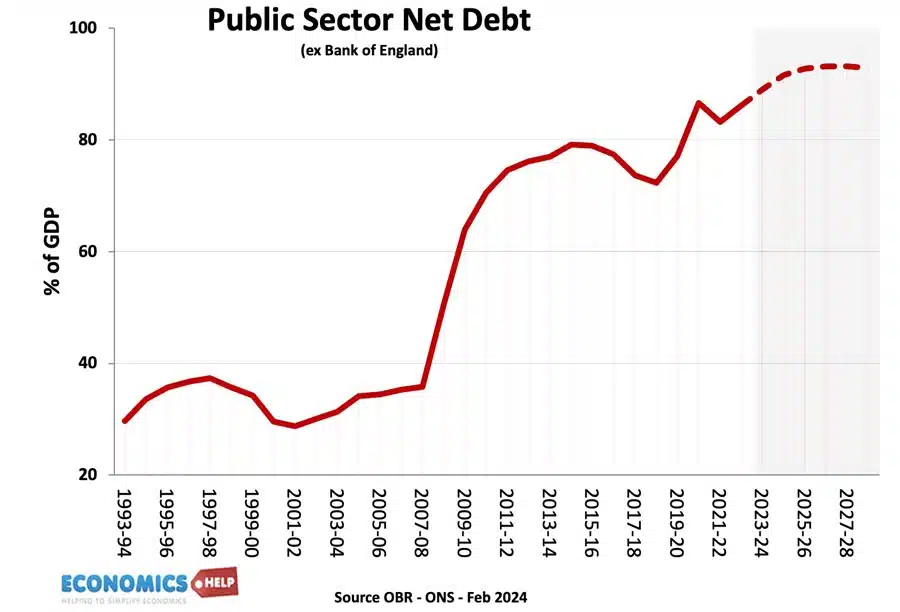
- The OBR have forecast substantial rises in UK debt over the coming decade because of demographic factors, putting strain on UK spending.
- Source: [1. ONS public sector finances,- HF6X] (page updated 20 Jan 2024)
Source: ONS debt as % of GDP – HF6X | PUSF – public sector finances at ONS
Reasons for National debt
- Enables the government to spend more during periods of national crisis, e.g wars, pandemics, and recessions.
- In a recession, the government will automatically receive lower tax revenues (less VAT and income tax) and will have to spend more on benefits (e.g. more unemployment benefits) This causes a cyclical rise in debt.
- Extra government borrowing during a recession can help provide fiscal stimulus to promote economic recovery. By borrowing and then spending more, the government is injecting demand into the economy and this can help to reduce unemployment. This is known as fiscal policy and was advocated by J.M. Keynes.
- Strong market demand for government debt. Private investors buy gilts because they are seen as risk-free investments and there is also an annual dividend from the bond yield. Since 2009, there has been strong demand despite very low-interest rates, meaning the government can borrow very cheaply.
- Finance investment. The government could borrow to finance public investment projects that can lead to higher growth in the future.
- Political convenience. There is usually political pressure to cut taxes and increase government spending. Allowing debt to rise can be a way for the government to avoid difficult choices.
Forecast for the National debt?

Source: Fiscal risks and sustainability – OBR – Economic and Fiscal Outlook Oct 2024
The OBR have forecast that, on our given trajectory, UK public sector debt could reach 350% of GDP within 50 years. The pessimistic outlook for national debt is made because
- An ageing population and demographic changes will put increased pressure on government spending, notably health care and pension spending.
- A smaller working population will limit UK’s productive capacity.
- Stress on finances from geopolitical events, such as frostier relations with China, Russia and the Middle East.
- Higher energy prices
- Costs of climate change.
- Declining tax revenues from petrol in a decarbonising economy.
- Low productivity growth of UK since the financial crash of 2009
- Recent boost to debt from the financial crisis and one-off cost of Coronovirus pandemic, which cut tax revenues and required government support for lockdown measures.
UK debt in context
Predicting debt for the next 50 years is difficult since we don’t know what kind of productivity improvements may come, e.g. continued gains in renewable energy may reduce the burden of higher oil and gas prices. Equally, the costs of environmental change could be worse.
History of the national debt

Main article: History of UK national debt
UK national debt since 1900

Source: Reinhart, Camen M. and Kenneth S. Rogoff, “From Financial Crash to Debt Crisis,” NBER Working Paper 15795, March 2010. and OBR from 2010.
These graphs show that government debt as a % of GDP has been much higher in the past. Notably in the aftermath of the two world wars. This suggests that current UK debt is manageable compared to the early 1950s. (note, even with a national debt of 200% of GDP in the 1950s, UK avoided default and even managed to set up the welfare state and NHS.
Debt reduction and growth

The post-war levels of national debt suggest that high debt levels are not incompatible with rising living standards and high economic growth.
- The reduction in debt as a % of GDP 1950-1980 was primarily due to a prolonged period of economic growth. See: how the UK reduced debt in the post-war period
- This contrasts with the experience of the UK in the 1920s when in the post First World War, the UK adopted austerity policies (and high exchange rate) but failed to reduce debt to GDP. Debt in Post-First World War period.
Budget deficit – annual borrowing
This is the amount the government has to borrow per year.
- Government
- borrowing in the financial year to December 2024 was £129.9

Annual borrowing since 1950. Figures for 2023-24 are forecasts (and rather optimistic!)
Debt and bond yields
Bond yields a the interest that the government pay bond/gilt holders. It reflects the cost of borrowing for the government. Lower bond yields reduce the cost of government borrowing.

Between 2007 and 2020, UK bond yields fell. Countries in the Eurozone with similar debt levels saw a sharp rise in bond yields putting greater pressure on their government to cut spending quickly. However, being outside the Euro with an independent Central Bank (willing to act as lender of last resort to the government) means markets don’t fear a liquidity crisis in the UK; Euro members who don’t have a Central Bank willing to buy bonds during a liquidity crisis have been more at risk to rising bond yields and fears over government debt.
See also: Bond yields on European debt | (reasons for falling UK bond yields)
Since 2021, bond yields have risen due to pick up in inflation

Cost of Interest Payments on National Debt

The cost of National debt is the interest the government has to pay on the bonds and gilts it sells. According to the OBR in 2023-24, debt interest payments will be £108 billion. (3.2% of GDP) or 5.2% of total spending. It is lower than in previous decades because of lower bond yields.
See also: UK Debt interest payments
The era of low interest rates post 1992 helped to reduce UK debt interest payments as a ratio of government revenue. However, with interest rates and borrowing increasing – debt interest cost have increased significantly.
Potential problems of National Debt
- Interest payments. The cost of paying interest on the government’s debt is very high. In 2011 debt interest payments will be £48 billion a year (est 3% of GDP). Public sector debt interest payments will be the 4th highest department after social security, health and education. Debt interest payments could rise close to £70bn given the forecast rise in national debt.
- Higher taxes / lower spending in the future.
- Crowding out of private sector investment/spending.
- The structural deficit will only get worse as an ageing population places greater strain on the UK’s pension liabilities. (demographic time bomb)
- Potential negative impact on the exchange rate (link)
- Potential of rising interest rates as markets become more reluctant to lend to the UK government.
However, government borrowing is not always as bad as people fear.
- Borrowing in a recession helps to offset a rise in private sector saving. Government borrowing helps maintain aggregate demand and prevents a fall in spending.
- In a liquidity trap and zero interest rates, governments can often borrow at very low rates for a long time (e.g. Japan and the UK) This is because people want to save and buy government bonds.
- Austerity measures (e.g. cutting spending and raising taxes) can lead to a decrease in economic growth and cause the deficit to remain the same % of GDP. Austerity measures and the economy | Timing of austerity
Who owns UK Debt?
The majority of UK debt used to be held by the UK private sector, in particular, UK insurance and pension funds. In recent years, the Bank of England has bought gilts taking its holding to 25% of UK public sector debt.

Source: DMO Debt Management Report 2022/23
- Overseas investors own about 28% of UK gilts (2022).
- The Asset Purchase Facility is purchases by the Bank of England as part of quantitive easing. This accounts for 26% of gilt holdings.
Total UK Debt – government + private
- Another way to examine UK debt is to look at both government debt and private debt combined.
- Total UK debt includes household sector debt, business sector debt, financial sector debt and government debt. This is over 500% of GDP. Total UK Debt
Private sector savings

When considering government borrowing, it is important to place it in context. From 2007 to 2012, we have seen a sharp rise in private sector saving (UK savings ratio). The private sector has been seeking to reduce their debt levels and increase savings (e.g. buying government bonds). This increase in savings led to a sharp fall in private sector spending and investment. The increase in government borrowing is making use of this steep increase in private sector savings and helping to offset the fall in AD. see: Private and public sector borrowing
Comparison with other countries

Although 107% of GDP is high by recent UK standards, it is worth bearing in mind that other countries have a much bigger problem. Japan, for example, has a National debt of 256%, Italy is over 157%. The US national debt is over 132% of GDP. [See other countries debt].
How to reduce the debt to GDP ratio?
- Economic expansion which improves tax revenues and reduces spending on benefits like Job Seekers Allowance. The economic slowdown which has occurred since 2010 has pushed the UK into a period of slow economic growth – especially if we consider GDP per capita growth. Therefore the further squeeze on tax revenues has led to deficit-reduction targets being missed.
- Government spending cuts and tax increases (e.g. VAT) which improve public finances and deal with the structural deficit. The difficulty is the extent to which these spending cuts could reduce economic growth and hamper attempts to improve tax revenues. Some economists feel the timing of deficit consolidation is very important, and growth should come before fiscal consolidation.
- See: practical solutions to reducing debt without harming growth
Other countries debt
See also:
31 million people work in the UK for an average of 44 hours a week at an average of GBP 12.5 per hour making 1,108,250,000,000 per annum and total savings are 17,050,000,000 excluding pension savings which are over 1,000,000,000,000 (which covers most of the public and private debt.
These figures compare favourably with the situation in 1850. They exclude all physical assets owned free of debt which are around 1,000,000,000,000,000 at current values, and also exclude investment abroad relating to assets registered as owned in the UK of around the same figure. As such the nett assets per head in the UK exceed any other G7 country. However the Italian figures are comparable because of the difficulty in assessing the asset values in Italy and those owned by the Catholic church.
It is about time people stopped playing with these silly figures.
Thanks first,but what about internationaly;outside UK…you have a nice day thanks
Great post Tejvan
I have a very radical idea on how we could reduce our national debt. So radical I believe that the government would never even have thought of taking such action. My idea is as follows:
1) Reduce the Member of Parliaments base wage to £40,000 per annum.
2) Make the MP’s office staff payed by the government directly rather than through the MP’s expenses.
3) MP’s are no longer allowed to put a second home on expenses unless that second home is less in its upkeep cost than the travel to the Houses of Parliament.
4) MP’s can only claim a maximum expenses per annum equal to and no more than their annual wages.
I believe that this radical idea would help our nation get out of the economic crisis that we are in now and back into being a nation we can all be proud to call our homes.
It really wouldn’t make any noticeable dent in the national debt of over £1,000 billion.
Oh yeah…cutting MP’s wages will really make a dent in the national debt!! What planet are you on..?
Thank you for the help..:)
Does anyone know why we have this debt that is borrowed against us the tax payers? In the 1400s England made the Bank of England to borrow against its future conquests in France . Since then the government has used and abused the rites to this . Therefor creating this arse hole of a mess. People need to understand the history of this problem before having a relivent salution
I drifted onto this site while looking for historical uk national debt charts. I imagine it is a help site for economics students?
That being so, I also imagine that your text books are still droning on about banks being a benevolent interface between savers and borrowers too – Absolute bollox !!
I’m sorry to inform you all that you are being had. High Street banks are not part of the story, they are the whole story since the age of ‘digital money’ (go to positivemoney.org.uk)
Banks create 97% of the UK money supply out of nothing at all. (the remaining 3% is produced as notes and coins by the Bank of England)
The banks create this money as loans and especially mortgages Between 2002 and 2009 high street banks piped £1trilllion into the uk property sector alone (which kinda explains why all you young people will never be able to afford to buy your own home)
Since 2008 the same bastards have pointedly refused to lend money at all especially to the business sector (Hence the lack of economic growth)
Do not be fooled by politicians blaming each other for the economic problems The culprits are the banks Politicians are distinctive only by the lengths to which they will go to grovel to the banks
Can you all remember the Greek Prime Minister being kicked out of office for questioning further austerity? (the banks did that)
Did you all pay attention to the Cypriot bail out solution (the banks came up with that idea)
Do you all realise that it is not Cyprus per se that requires bailing out … yes you guessed it … it is Cyprus banks that need money
Go to positivemoney.org.uk We desperately need you young people to understand 21st century economics – not dated crap
We are in this state of ruin because ‘Conservative Values’ prevent any meaningful use of money either made or borrowed! During the first 2.5 years since the coalition got in they borrowed £500bn (0.5 Trillion) and did not invest in engineering, technology, manufacturing or indeed any tangible business other than ‘financial products’ (Ponzi schemes). This has been yet another lesson in hardship that seems to happen with every Conservative run government. Sadly for any Liberals out there Mr. Clegg did nothing to halt this, more so he joined in with the Conservatives as they ‘taught us all another lesson’! This time perhaps the lesson is learned, never ever vote Tory!
The debt-to-GDP ratio is not 73% but closer to 55% because we own the Bank of England. You say that the Band of England holds 25% of government debt. Whatever debt we owe the Bank of England we owe to ourselves and thus this should not be considered debt. A little like a husband who owes money to his wife: If the two share joint accounts and all monies then the husband doesn’t owe anything, in effect.
We have spend the last few months buying back government debt through quantitative easing (printing money). This should show up on the debt-to-GDP ratio and the OBR should report the figure as 55%.
The intention of the Bank of England purchases of gilts is to be just temporary, and the gilts will be sold back onto open market when Q.E. ends
Mike, thank you for that. I have been trying to determine that and figure it out for myself also. So although it is not healthy we have room to work on it.
At least hope so.
How sustainable do you think that the austerity measured imposed on European countries are in economic and political terms?
Great site. Saw this video recently towards ‘A New Economic Policy for Great Britain’. Some radical ideas there. http://www.youtube.com/watch?v=apAY-R4263Y