Bond Yields Explained

us-bond-yields
  • UK bond yields are the rate of interest received by those holding Government bonds.
  • Governments sell bonds (also called gilts) via the Debt Management Office to fund their budget deficits. Bonds are a way for the government to borrow – a bit like the government taking out a loan.
  • Government bonds are frequently traded on bond markets. Therefore, their market price may be quite different to the original price set by the government.

Example of why bond yield changes

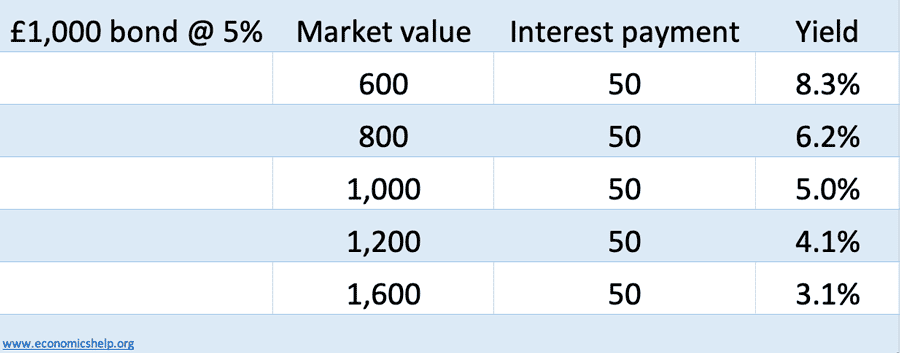
A government may sell a 10-year, £1,000 bond at 5% interest. This means every year the government will pay £50 to the holder of this bond.

  • If demand for government bonds rose, this £1,000 bond would increase in price as investors pushed up the market price.
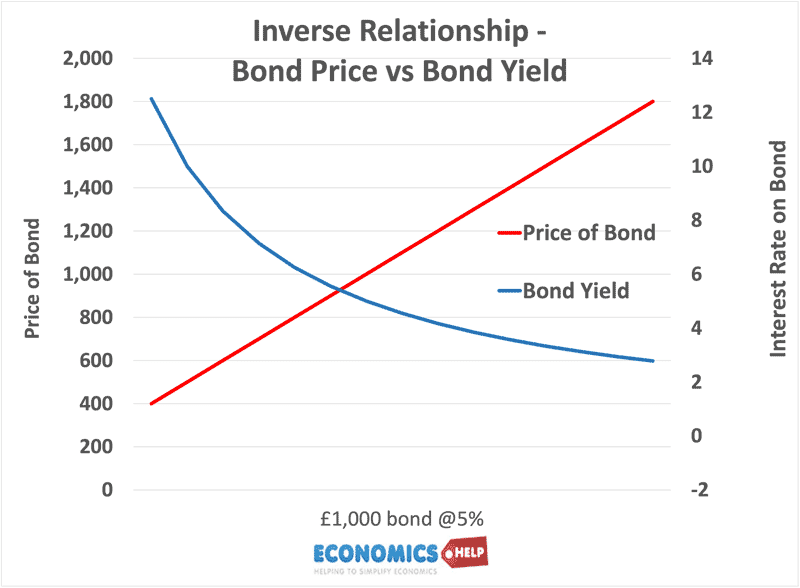
  • But, the government still pay £50 a year interest until maturity. If the market price of the bond rises to say £2,000, the interest rate (yield) is now 2.5% (50/2,000)
  • Therefore higher demand for bonds leads to lower bond yields.
  • Conversely, if people sell bonds, this pushes up the bond yield (e.g. what happened in UK September 2022)

How a change in price of a bond changes the effective yield
bond-yield-price

The law of the bond market

inverse-relationship-bond-yield-vs-bond-price

  • As bond value rises, interest yield falls
  • As bond value falls, interest yield rises

Video summary

Recent UK Bond Yields

10-year-gilts-85-22-web

Source: Bank of England – 10-year bond yields

Read more

Investment in UK – Business and Public Sector

uk-business-investment-labels

uk-business-investment-labels

Source: ONS NPEN

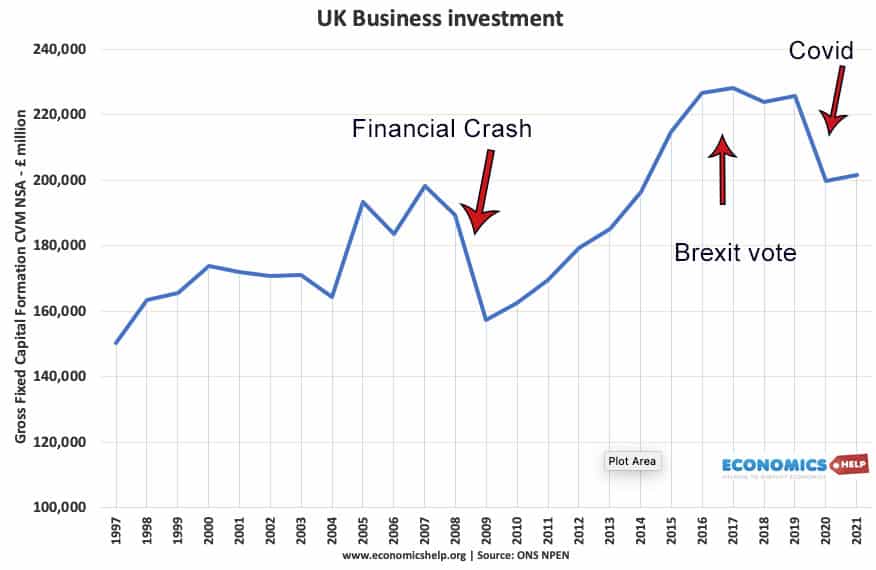
Total UK Business investment since 1997. After sharp fall in 2009 due to global recession, investment recovered quite strongly. In 2016, Investment fell, at least in part, due to the uncertainty of the Brexit vote and leaving the Single Market. The covid pandemic caused another sharp fall in investment.

investment-uk-gan8

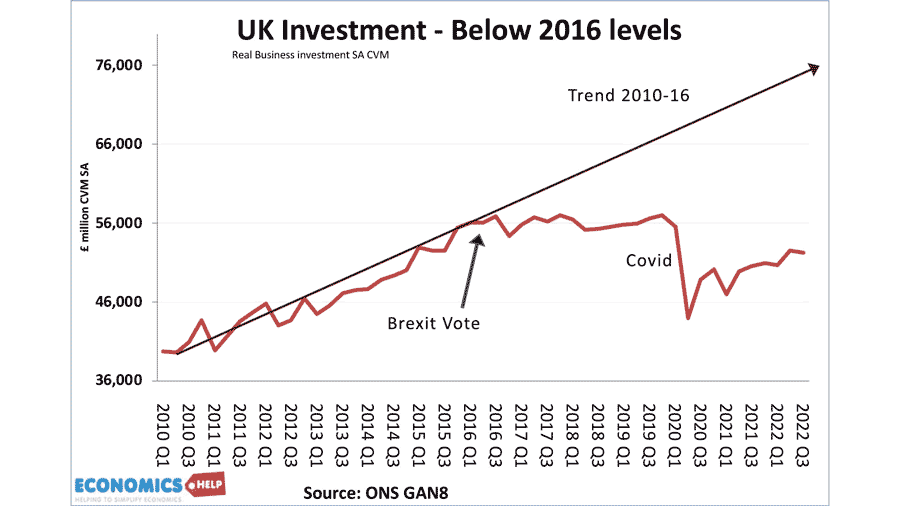
The poor investment performance is concerning for the UK economy as it is reflected in poor productivity growth, low economic growth and limited real wage growth

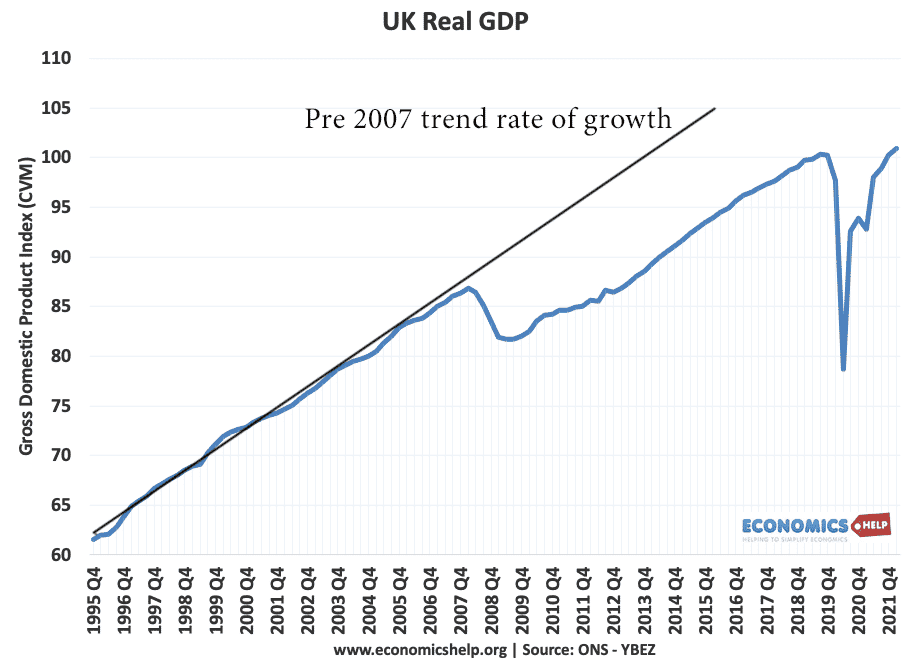
real-gdp-1995-2022-with-trend-rate

UK real GDP has never recovered its pre-2007 trend rate of growth.

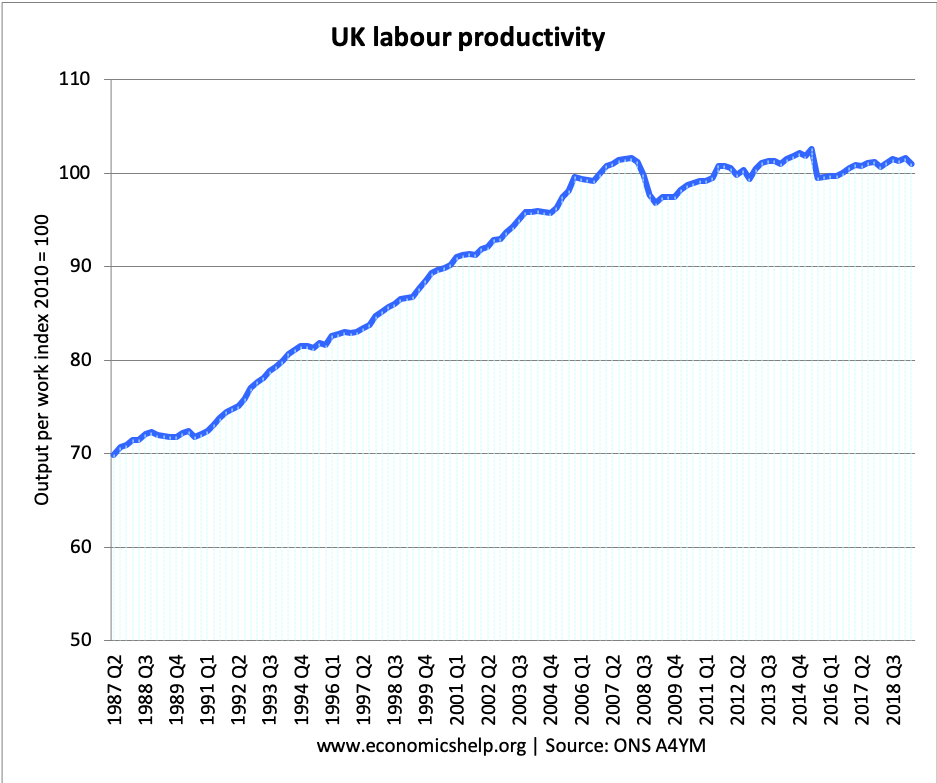
labour-productivity-index-1986-20

The poor levels of investment post 2008 are reflected in poor labour productivity growth.

Investment in profile

From 2007 to 2010 we see a 22% fall in private sector business investment. This was the result of

  • Banking crisis – banks didn’t want to lend
  • Fall in consumer confidence
  • Recession, which caused firms to hold bank from investment

Recovery in business investment since 2010

  • From a low basis and 20% fall
  • Helped by low interest rates making investment more attractive, but availability of funds a bigger problem than the cost of borrowing.
  • Business investment has fallen behind past trend growth in value of business investment.
  • Still volatile and uncertain, e.g falls in 2014 and the end of 2015

Factors influencing future investment levels

  • Despite low interest rates, banks are maintaining strict lending criteria and rationing finance. Many small and medium sized firms still state finance is difficult to come by.
  • Prospects for economic recovery are poor. The Bank of England’s latest inflation report painted a gloomy picture of an economy struggling to post positive economic growth.
  • Fall in inflation rate and possible deflationary pressures
  • Uncertainties over Britain’s place in Europe.
  • Euro-zone debt crisis and EU recession also weigh heavily on UK investment decisions.
  • Future of interest rates. Will interest rates rise to increase the cost of borrowing.

Read more

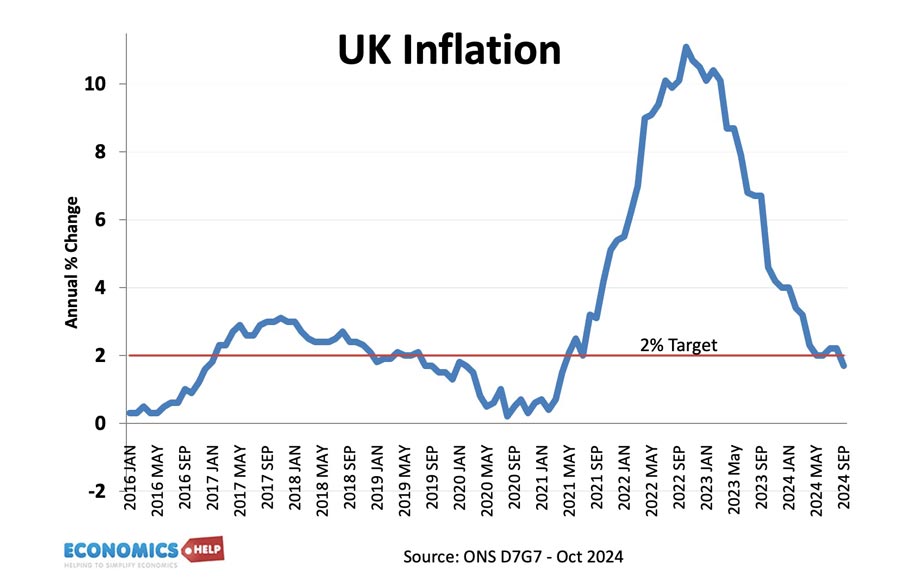
UK Inflation Rate and Graphs

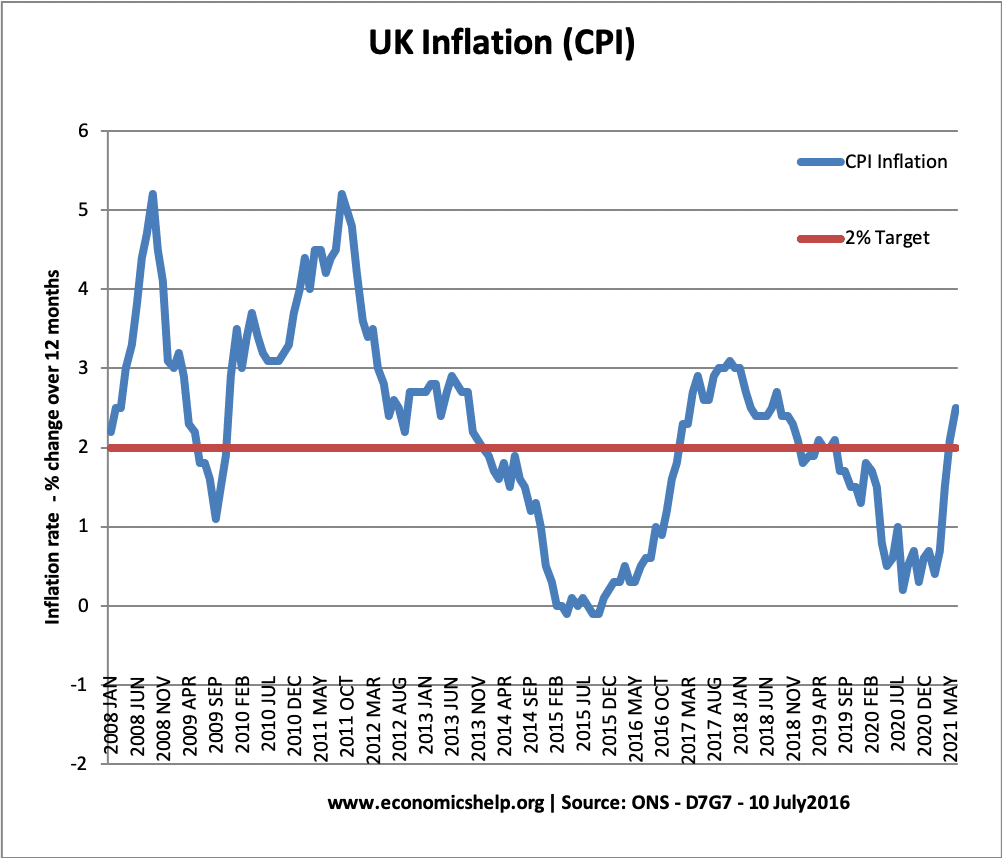
UK-CPI-Inflation

Current UK Inflation Rate

UK-inflation-may-2022


  • CPI inflation rate:  9.0% (headline rate) CPI – D7G7 at ONS
  • (page updated 19 May 2022)

Other measures of inflation

Reasons for low inflation in the UK until 2021

  • Low worldwide inflationary expectations. Europe is experiencing very low rates of inflation.
  • Fall in global inflation rates since 2007.
  • Reduced consumer spending due to Covid downturn
  • Weaker commodity price growth.

Reasons for surge in inflation during 2022

  • Rising oil prices
  • Rising gas prices
  • Ukraine war disrupting gas/energy and food supplies.
  • Lingering supply side issues from Covid lockdowns and impact on price of shipping.

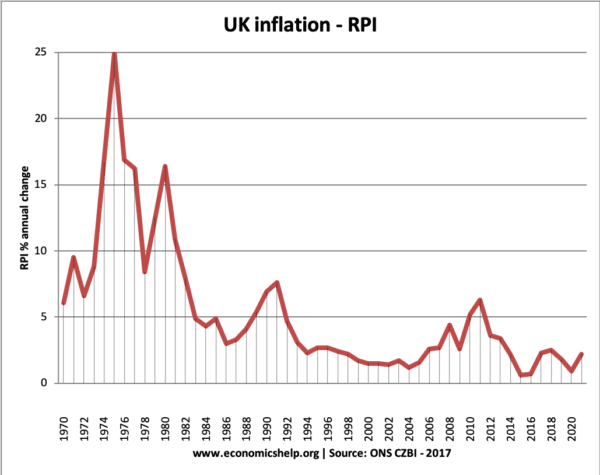
Inflation trends in the UK

uk-inflation-since-1970

Despite temporary cost-push inflationary factors in 2017, underlying inflationary pressures remain muted – at least compared to the past four decades.

The current UK inflation rate compares favourably to much of the post-war period.

1970s Inflation

The 1970s frequently saw double-digit inflation. This was due

  • Cost-push factors – rapid rise in oil prices
  • Rising wages due to powerful trade unions trying to keep up with living costs.
  • Lack of independent monetary policy
  • Inflation expectations rose

Late 1980s inflation

The inflation of the late 1980s was due to

  • Rapid economic growth ‘The Lawson Boom‘ – growth was above the trend rate causing supply shortages
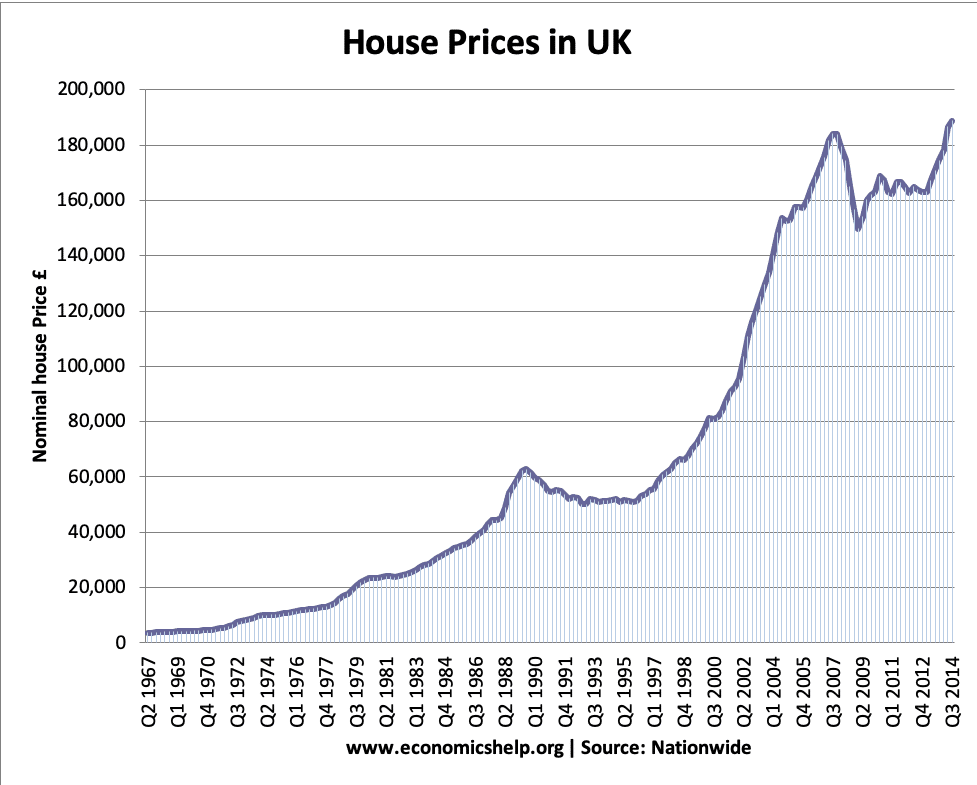
  • Rise in house prices fuelling wealth effect
  • Lack of independent monetary policy. The policy was partly set by ‘shadowing the D-Mark’ which led to loose monetary policy in late 1980s

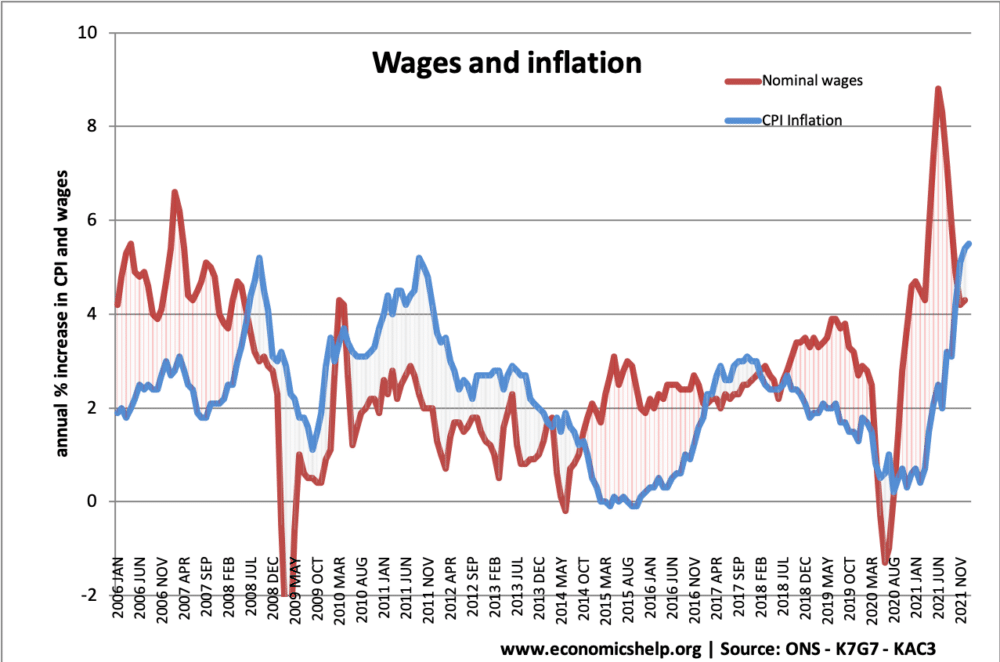
Inflation and wages

  • Real wages = nominal wages – inflation.
  • Usually, during a period of economic growth – wage growth is higher than inflation, this leads to positive real wage growth.
  • During the economic recession of 2009-13 – we had a prolonged period of negative real wage growth. Wages rising at a slower rate than inflation.
  • The end of 2014 saw the first signs of renewed wage growth and positive real wage growth.

wages-inflation-mar-2022


Since 2008, there has been an unusual period of negative real wage inflation. (inflation higher than wage growth)

However, since the recovery from the Covid downturn, there has been a sharp increase in wages (likely to prove temporary)

See more at UK wage growth

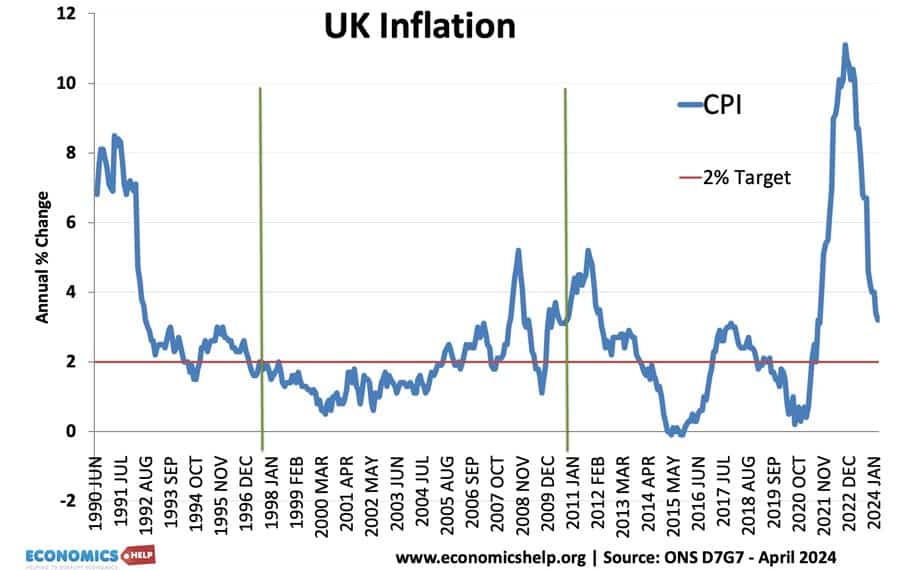
Inflation since 1990

uk-inflation-1989-2021-

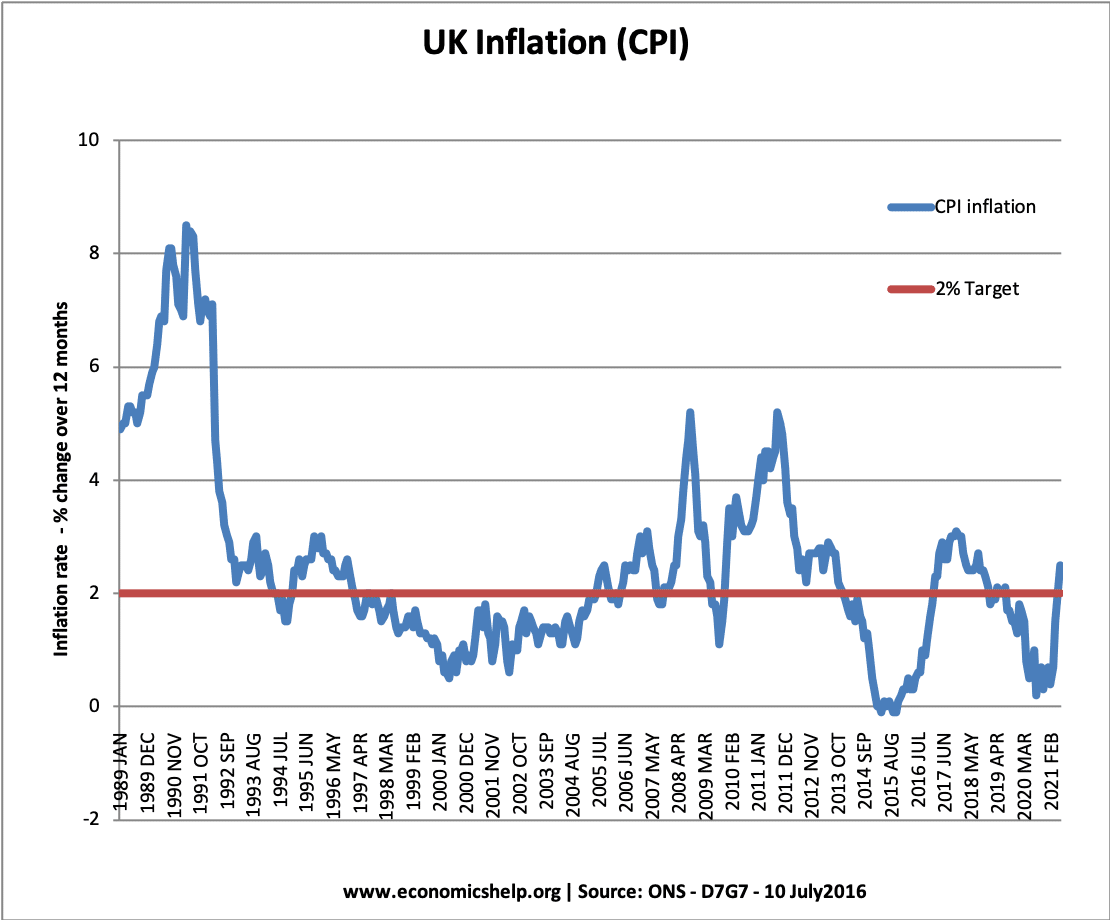
  • Inflation rose over 8% in the late 1980s due to the Lawson boom, which was a period of unsustainable economic growth.
  • Inflation was low in the period 1992 to 2007. This was a period known as the ‘great moderation’
  • The inflation of 2008 and 2012 was due to cost-push factors (devaluation and rising commodity prices)

Read more

Savings ratio UK

saving-ratio-97-2020
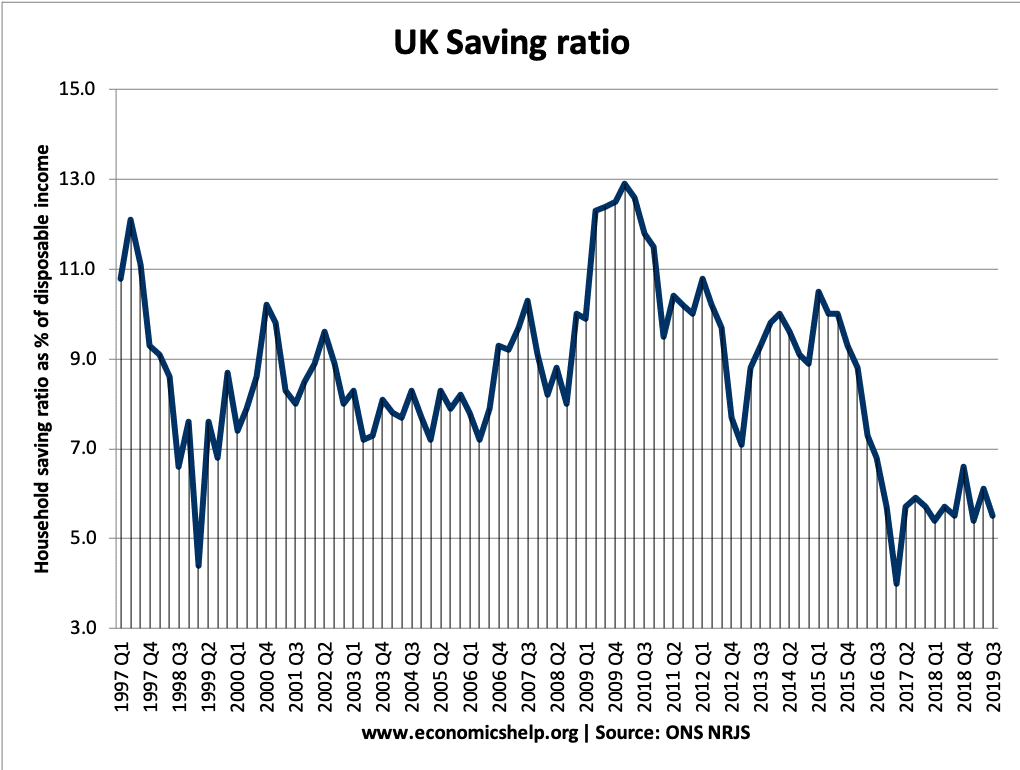
  • Definition of Household savings ratio: The percentage of disposable income that is saved. (1)
  • Total savings = Disposable income – Household consumption

UK Saving Ratio

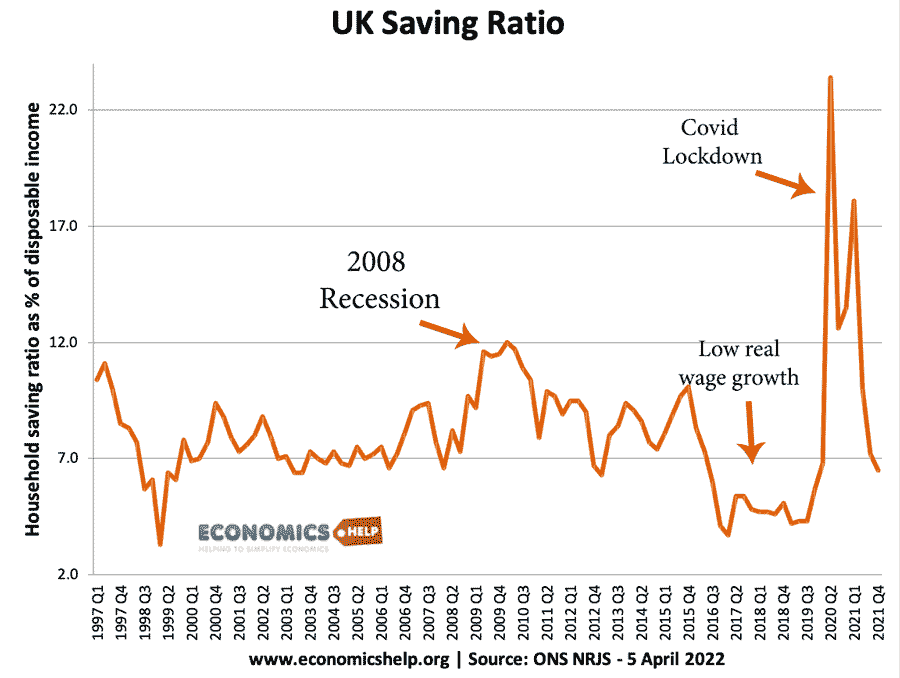
  • Latest UK household savings ratio: 2021 = 10% But, by 2021 Q4 the saving ratio had fallen to 6.2%
  • By contrast, the average savings ratio in the past 54 years is 9.2% of disposable income.

Rise in savings during Covid Pandemic

2020/21 saw a spike in the savings ratio due to the unusual circumstances of the Covid Pandemic. With normal economic activity curtailed many households were unable to spend on usual items like holidays, leisure and going out. Therefore, household savings rose sharply. With the end of covid lockdowns, the savings ratio fell. The forecast for savings in 2022 and 2023 is for savings to fall sharply due to the cost of living crisis, with many households seeing a fall in real income. This will cause households to run down savings to meet the rising cost of fuel and energy.

uk-saving-ratio-97-22-markers

UK Saving ratio. Source: National income accounts  NRJS dataset

NRJS = Households + NPISH (Non-Profit Institutions Serving Households)

Low saving ratio 2017-2019

This period saw a significant fall in the UK savings ratio to a record low. This fall in the savings ratio has been caused by

  • Fall in real wages
  • Depreciation in Sterling post-Brexit – pushing up the cost of living and contributing to falling in real wages
  • To maintain spending, consumers have borrowed and dipped into savings
  • Temporary factors (high tax payments on dividends)

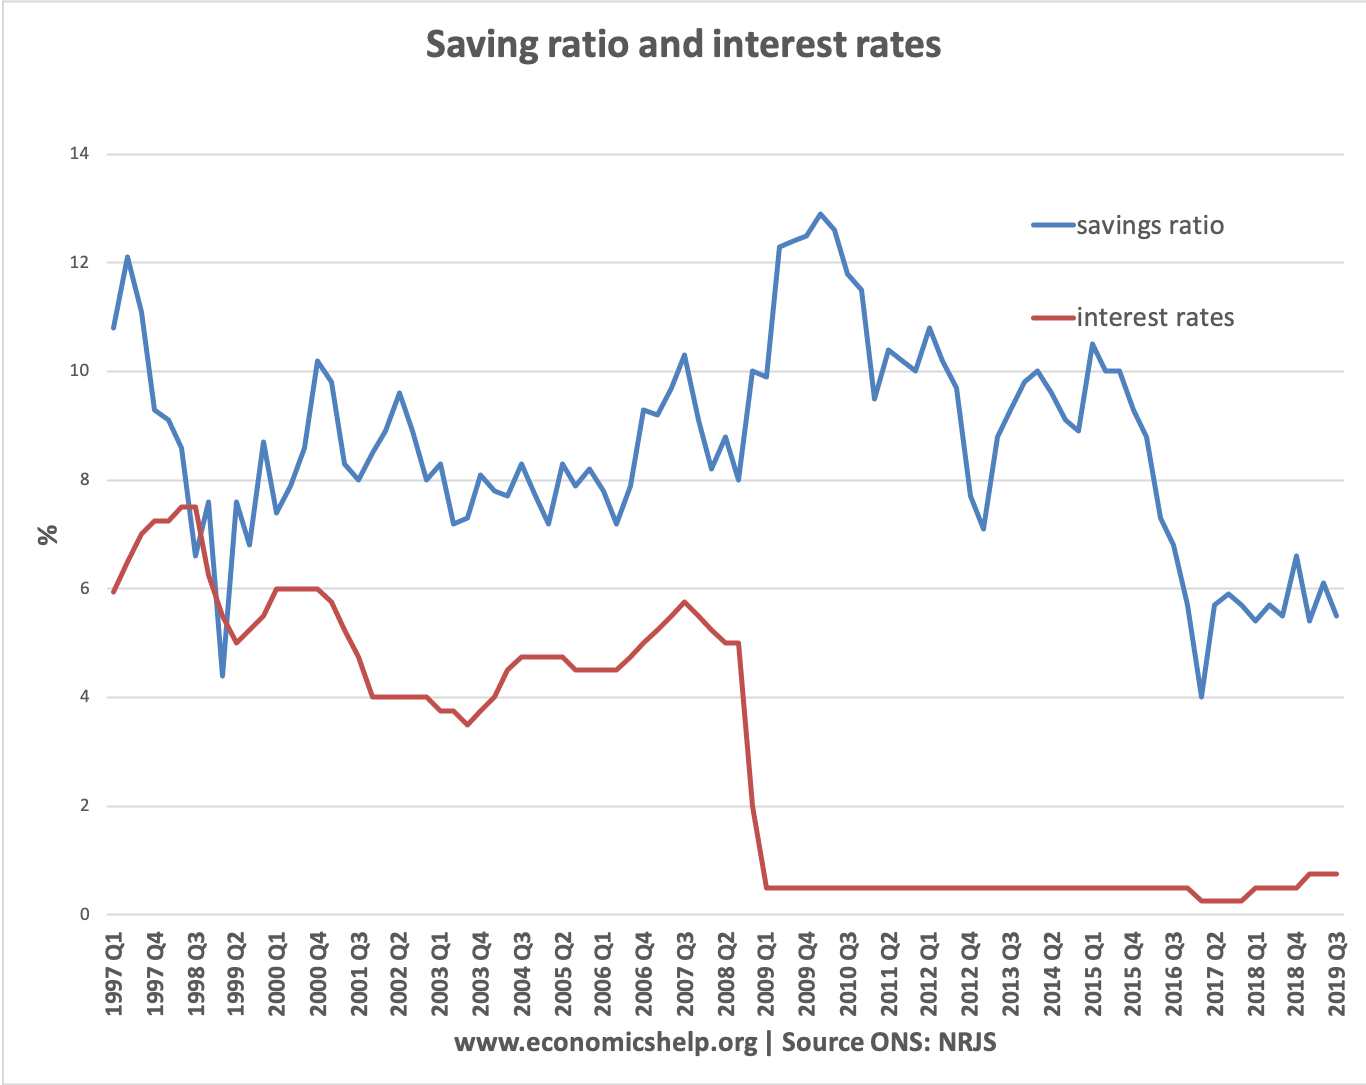
Saving ratio and base interest rates

base-rates-saving-rates-97-20

In theory, lower interest rates reduce the incentive to save. But, the interest rate is only one of many factors influencing decisions to save. The most important factor is the state of the economy. In 2009, we saw a rapid rise in the saving rate because of the recession – despite interest rates cut to zero.

Read more

UK Balance of Payments

balance-payments-1985-20

The balance of payments is the record of a country’s transactions / trade with the rest of the world.

The balance of payments consists of:

  1. Current Account (trade in goods, services + investment incomes + transfers)
  2. Capital Account / Financial Account (capital and financial flows, net investment, portfolio investment)
  3. Errors and omissions. It is hard to collect all data so some is missed out.

In theory there should be a balancing between capital and current / financial account. If there is a current account deficit, there should be a surplus on the capital / financial account.

UK Current Account

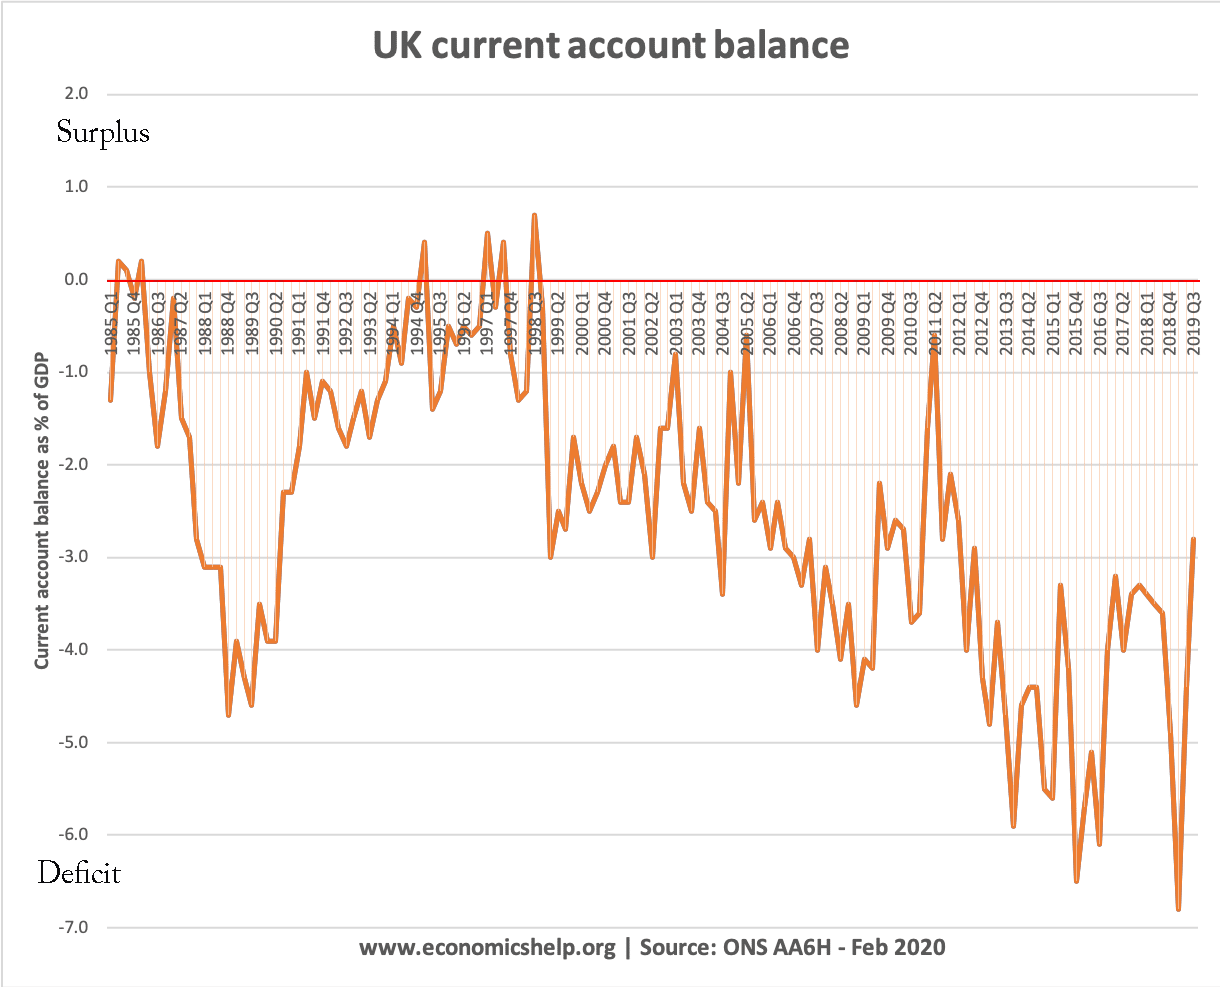
The UK has had a persistent current account deficit in the past 15 years. This is caused largely by the deficit in trade in goods, and recently a deterioration in investment incomes.

  • In Q3 2019, the UK current account fell to £15.9 billion or 2.8% of gross domestic product (GDP)
  • In 2019, as a whole – the UK’s current account deficit was close to 4% of GDP at current market prices.
  • The UK has had a persistent current account deficit in recent years.

balance-payments-1985-20

Source: ONS Balance of Payments Current account as % of GDP

Read more

Economic Growth UK

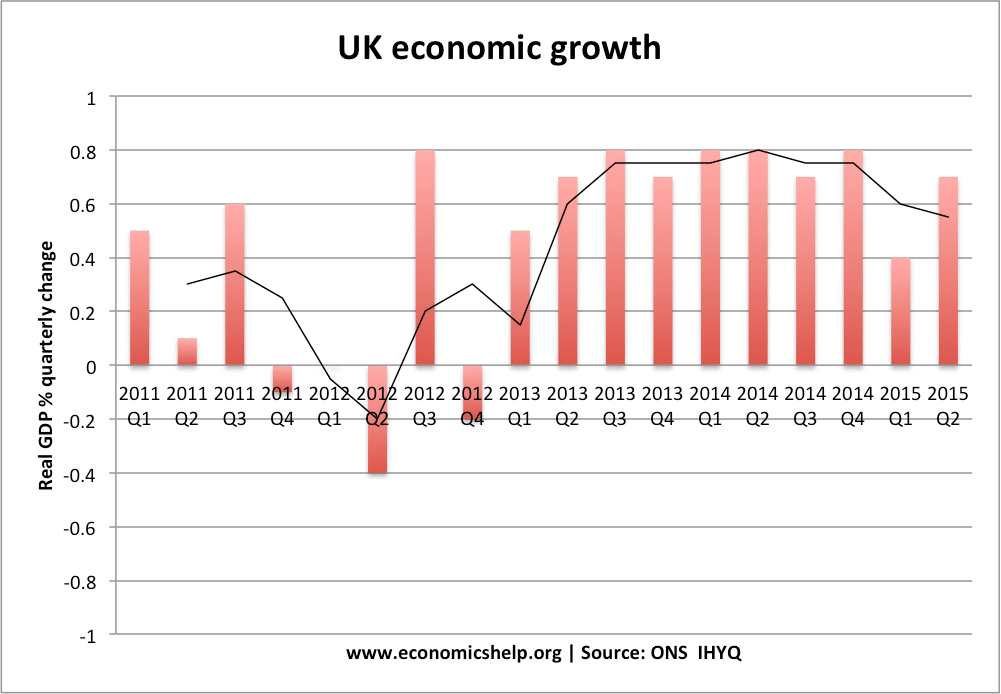
Economic growth measures the change in real GDP (national income adjusted for inflation; ONS call it chained volume measure of GDP) Since the end of the great recession (2008 – 2009) the UK economy has grown in fits and starts. It has been a relatively weak economic recovery compared to previous recessions. 2019 has seen …

Read more

Finding economic stats and data at ONS and Bank of England


Quick links for main economic statistics

My page with graphsMain ONS datasetUseful direct links
Economic growthNational income accReal GDP | % quarterly
Inflationinflation seriesCPI annual %
UnemploymentLabour market ILO %
Current account b of ppnbpC.A % GDP
Budget deficitpsf at ONS | psf at HM TPSNB % GDP
Public sector debtpsf at ONSPSND % GDP
Labour productivityprdy datasetlab. prod. % change
Saving RatioNat.l inc. acc: J3household savings %
Business investmentBusiness investment
Housing marketNationwide datahouse price index ONS
UK wage growth average earnings S.A % change
Industrial + manuf outputindustrial productionindex of output

Bank of England data
UK Bond yieldsBank of England 10 year bond yields
Exchange ratesSterling exchange rate
Money supply (BM4 at B of E)

Other data

Readers Questions: I’m pretty good at finding data at FRED. But I have no luck finding what I want at ONS. Do you have a post on that? Or some guidelines that might help me? Would be great!

It’s a good question. I’ve spent the past four years finding my way around the ONS database and website (and updating links the last time they changed URLs). I’ve spent many hours looking for certain statistics. The good news is that nearly all the important ones are there, if you dig hard enough. Though some data like exchange rates, bond yields, interest rates and money supply you will need Bank of England database.

Sometimes it’s frustrating because all you want is the % change in real GDP, and you have to wade through statistics on S.A Output in fishing and forestry.

A few points.

  1. If you get stuck, ONS have been very helpful in pointing out to me the relevant page. So it might be worth using the contact page, if you do get stuck
  2. Sometimes, the hardest thing is knowing where to find a statistic. For example, finding the savings ratio was difficult, because it’s not intuitive you need to look in National accounts – Household sector – saving ratio
  3. In some cases, other sources of data are better, e.g. for housing I still think Nationwide is better than the ONS, though the ONS seem to be giving housing more importance.
  4. It’s also worth checking out:

Tips on getting data

I subscribe to the ONS RSS feed so I can see when new publications come out.

Read more

Item added to cart.
0 items - £0.00